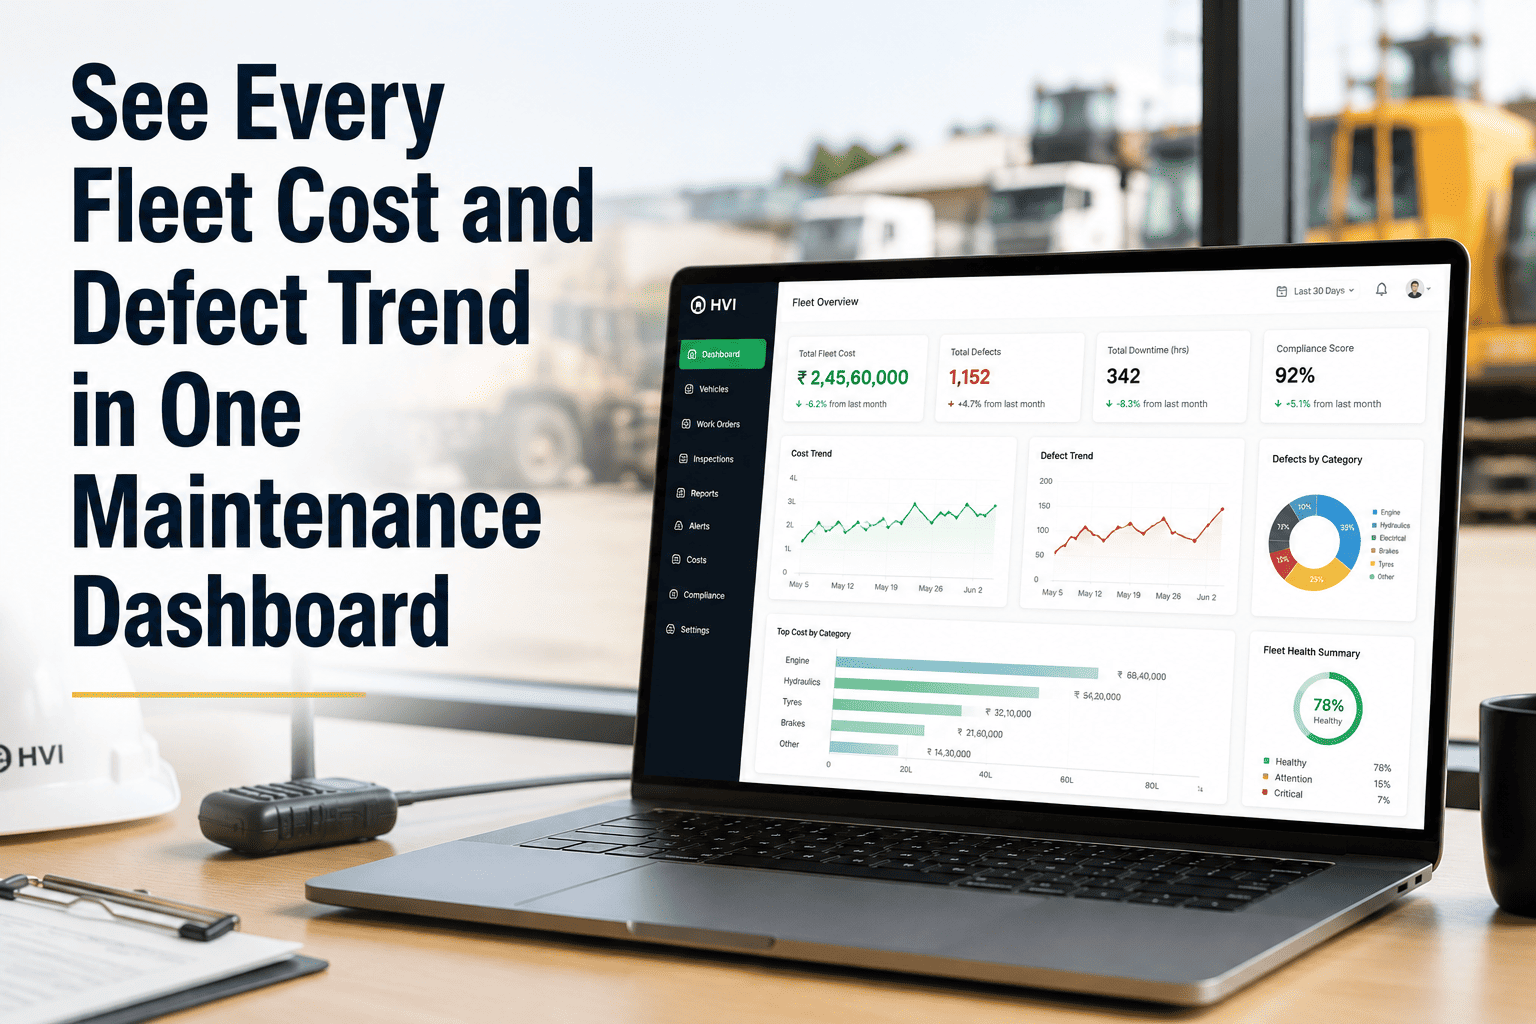
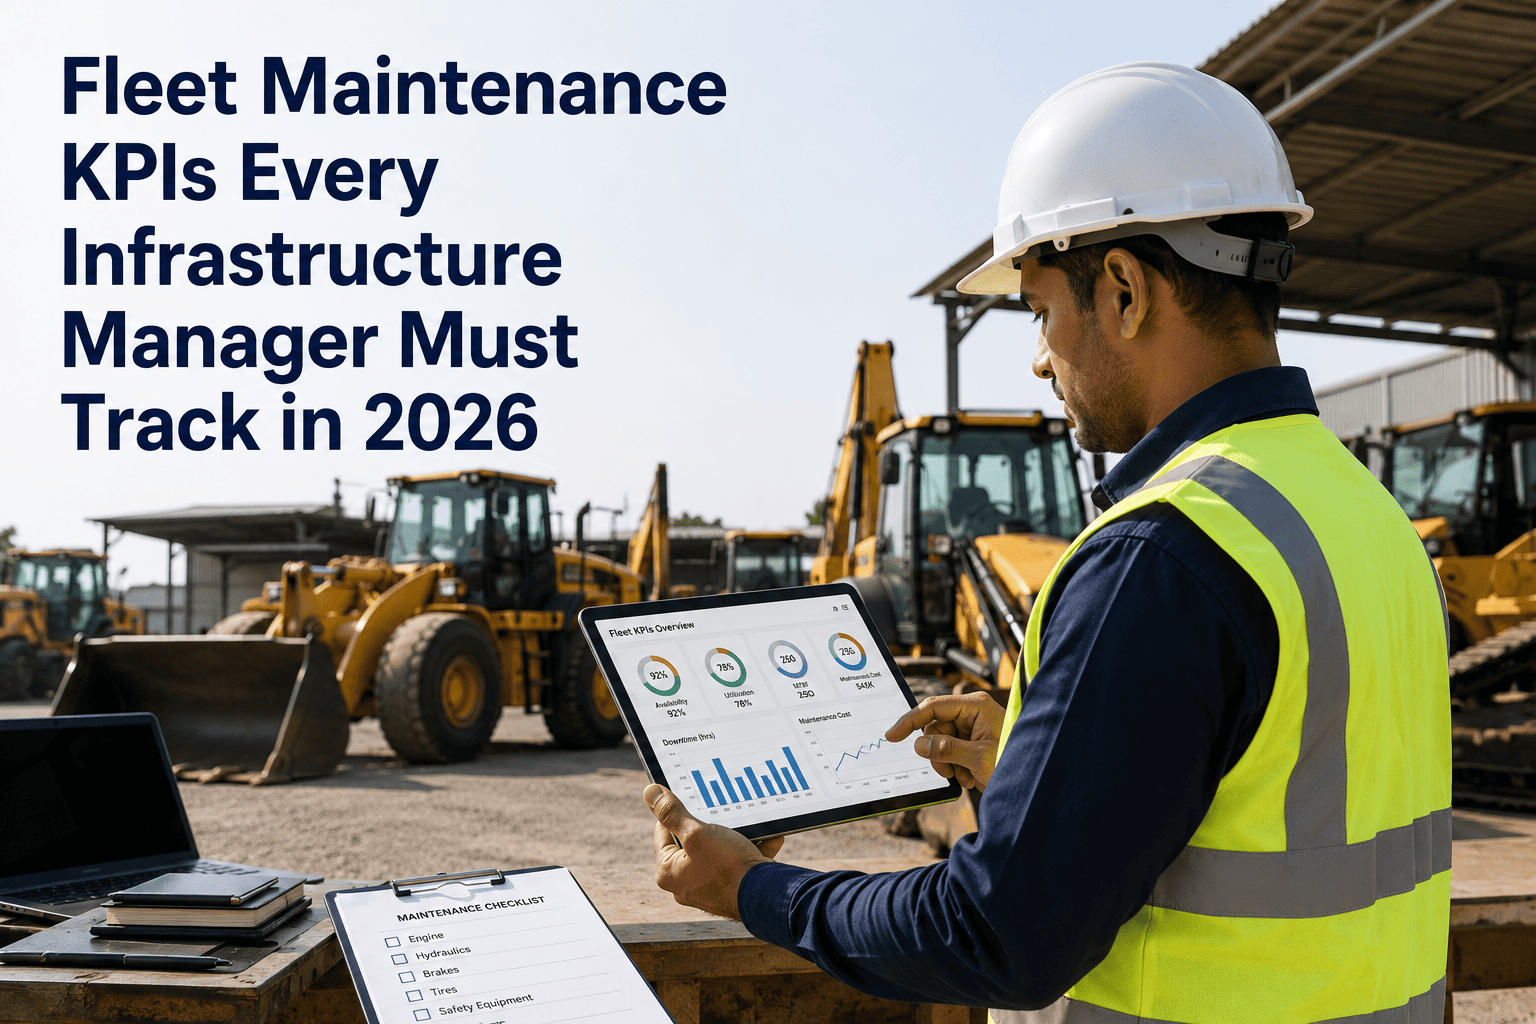
Ask ten Indian fleet managers what KPIs they track and you will hear fifty different answers — cost per km, cost per hour, downtime, uptime, availability, MTBF, MTTR, PM percent, defect rate, WO cycle time. Half of these overlap, half contradict each other, and none of them mean much on paper because paper cannot compute them in real time. This piece cuts the noise down to the 5 KPIs that actually move the needle on Indian construction, mining and infrastructure fleets — with formulas, benchmarks, common ways they get gamed, and the specific fix that makes each one live-trackable. If you want these 5 KPIs live on your own fleet inside a week, you can start a 14 day free trial and see the first values populate within the first day.
5 Fleet Maintenance KPIs Every Fleet Manager Should Be Tracking
The 5 KPIs that actually move the needle on Indian construction and mining fleets — with formulas, benchmarks, the ways they get gamed, and the specific fix that makes each one live.
Why These 5 And Not The Others
The 5 KPIs below are the ones that survive scrutiny: they are directly actionable, they resist gaming better than most, they compound across each other (fixing one improves the others), and they map cleanly to specific interventions your workshop and site teams can take. Everything else on the typical KPI list is either a derivative of these 5, a vanity metric that looks good in board decks, or a lagging indicator that tells you about a problem you cannot fix anymore. Track these 5 well and every other KPI you might care about becomes easier to move.
Cost Per Asset Per Hour
The most important single number in fleet maintenance. Total maintenance spend on an asset (parts plus labour plus outside repair) divided by operating hours in the same period. Roll up across assets for fleet-level view, or drill down to a single dumper for asset-level decisions.
Total maintenance cost in period divided by operating hours in period. Include parts, labour, outside repair, statutory. Exclude fuel and operator wages.
Dumpers Rs 400-600 per hour, excavators Rs 300-450, loaders Rs 200-350, DG sets Rs 100-200. Actual varies with OEM, age and site conditions.
Cost gets under-reported by expensing to wrong project, hours get over-reported to inflate the denominator. Both make the number look better than it is.
Every WO auto-tags asset and cost centre. Meter readings captured on mobile with GPS. Manual re-allocation impossible. Number stays honest.
PM Adherence
The single strongest leading indicator of future downtime. Percentage of scheduled preventive maintenance tasks completed on time versus planned. Track by asset, by class, by site — deferred PMs pile up and eventually produce breakdowns.
PMs completed on time divided by PMs due in the period, expressed as a percentage. On time typically means within +/- 10 percent of the scheduled hour or day.
Year 1 realistic target 80 to 85 percent. Year 2 target 90 plus percent. Enterprise best-in-class 95 plus percent sustained. Sub-70 percent is a warning.
PMs signed off without full task completion. Meter readings rolled back to keep asset "not yet due". Phantom sign-offs in paper systems.
Every PM task requires photo evidence and digital sign-off. Meter tampering flagged. Deferrals require supervisor approval with reason code.
Mean Time Between Failures (MTBF)
The reliability KPI. Average operating hours between unplanned failures on an asset or asset class. Rising MTBF over quarters means your PM plan is working. Falling MTBF means something is degrading and needs intervention.
Total operating hours in period divided by number of unplanned failures in the same period. Exclude scheduled PMs. Include only breakdowns that stopped the asset.
Well-maintained HEMM 200 to 400 hours MTBF. New assets under warranty often 400 plus. Older assets and harsh sites 100 to 200 hours.
Breakdowns get reclassified as PMs to keep the failure count low. Minor stoppages under a threshold get ignored. Numerator gets inflated with idle hours.
WO source (auto from defect vs PM trigger) captured at creation. Reclassification impossible after the fact. Operating hours from ECU or captured with GPS timestamp.
Defect Trend By Asset Class
The early warning system. Number and severity of defects captured per asset class per week. A rising defect trend on any class signals a systemic issue — worn component batch, site condition change, operator training gap — before it becomes a breakdown.
Defects captured per asset per week, grouped by class and severity. Compare week over week and month over month. Rolling 4-week average smooths noise.
Healthy fleet 0.5 to 1.5 defects per asset per week captured (yes, higher is often healthier — it means the process is working). Zero defects is a warning sign.
Operators under-report defects to avoid blame. Supervisors filter defects before they reach the WO board. Categories get renamed to hide patterns.
Timestamped mobile defect capture protects the operator. All defects flow directly to WO board. Anonymous near-miss reporting available. Trend visible to fleet head daily.
Work Order Cycle Time
The workshop efficiency KPI. Average time from WO creation to closure, tracked by priority and defect type. Rising cycle time signals capacity bottleneck, parts issues or mechanic skill gaps. Falling cycle time compounds directly into higher availability.
Sum of (close time minus create time) across all WOs closed in period, divided by number of WOs. Segment by priority: critical, high, medium, low.
Critical 4-8 hours, High 12-24 hours, Medium 1-3 days, Low up to 7 days. Longer than these on the Indian construction and mining norm signals a problem.
WOs closed on paper without work done, then reopened when supervisor spots the issue. Creation timestamps back-dated. "Waiting parts" status abused to pause the clock.
Closure requires digital signature plus photo evidence. Creation timestamp unfalsifiable. Waiting parts is a separate metric so the cycle time number stays honest.
See These 5 KPIs Live On Your Own Fleet
Start a 14-day free trial. HVI's dashboard begins populating all 5 KPIs within the first day of onboarding. First trend data emerges in a week. Full quarterly baselines in 90 days.
Paper Vs Digital · Why Tracking Fails On Paper
The 5 KPIs above are only useful if they are current, honest and drillable. Paper systems fail on all three counts. Here is what changes when tracking moves onto a live platform.
| Attribute | Paper Tracking | HVI Live Tracking | Business Impact |
|---|---|---|---|
| Data Freshness | Days to weeks stale | Real time | Decisions on current not historic reality |
| Gaming Resistance | Timestamps forgeable | Timestamped and photo-evidenced | KPI reflects operational truth |
| Drill-Down | Impossible without days of reconciliation | One click to source WO | Root cause found in seconds |
| Cross-Asset Compare | Manual Excel merge required | Native to the platform | Outliers identified fleet-wide |
| Trend Detection | Only visible in monthly reviews | Rolling window automatic | Warning before breakdown, not after |
| Audit Readiness | Days of prep for DGMS or Factories Act | Report exportable in one click | Compliance overhead near zero |
Which KPI To Fix First
You cannot fix all 5 at once. Use this decision framework to pick which KPI to attack in your first 90 days based on the biggest pain your fleet is feeling right now.
Fix cost per asset per hour first. Identify the top 5 highest-cost assets. Drill into their WO history to find the underlying pattern. Fix parts, PM adherence or replacement decision.
Fix PM adherence first. Get to 85 plus percent adherence within 90 days. Breakdown frequency drops 40 to 60 percent as a consequence. MTBF starts trending up.
Fix MTBF tracking first. Establish the baseline. Compare against OEM specification. Escalate systematic gaps to OEM warranty and to procurement for future asset selection.
Fix defect trend tracking first. Increase capture rate from operators. Build the leading-indicator view. Prevent surprise failures with early intervention.
Fix WO cycle time first. Analyse the bottleneck — mechanic capacity, parts availability or approval workflow. Cut cycle time and availability recovers directly.
Frequently Asked Questions
Get These 5 KPIs Live On Your Fleet This Month
HVI Fleet Dashboard is live on Indian construction, mining and infrastructure fleets replacing paper-era KPI reports with real-time cost per asset, PM adherence, MTBF, defect trend and WO cycle time visibility. Start a 14-day free trial or book 30 minutes with our team to walk through the 5 KPIs on your fleet.