An infrastructure manager running 40 machines across three highway packages can usually tell you how many sites are active this week. Ask the same manager what their fleet's MTTR was last month, or what percentage of preventive maintenance ran on schedule, and the answer is often a guess. That gap between "busy" and "measured" is exactly where Indian EPC and infrastructure fleets lose the most money — not to one big failure, but to dozens of small ones nobody tracked. This page lays out the 12 KPIs that separate fleets running on instinct from fleets running on data, with the formulas, benchmarks, and dashboard structure to track every one of them. Sign up free to see these 12 KPIs calculated automatically from your own fleet data.
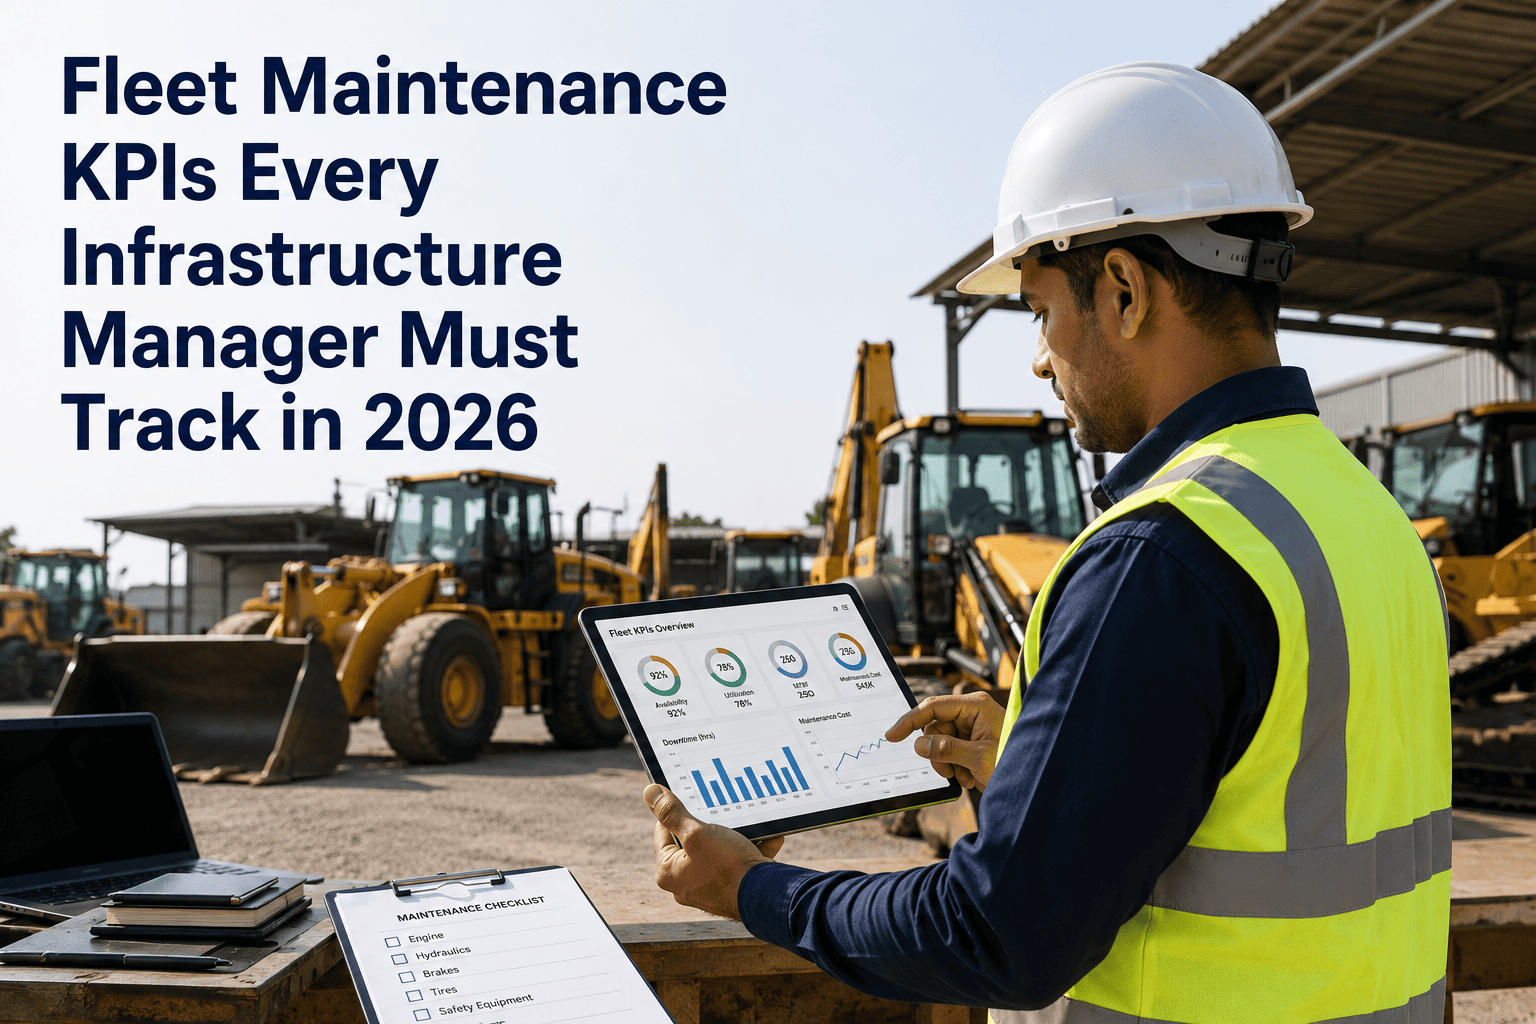
12 Fleet Maintenance KPIs Every Infrastructure Manager Must Track
From MTTR to cost per asset — the exact metrics top-quartile EPC fleets use to cut downtime, prove ROI, and stop reactive firefighting.
Why Most Infrastructure Fleets Fly Blind
A site engineer logs a breakdown on paper. A technician fixes it without recording parts used. A PM gets done three days late and nobody notices. None of this looks like a problem day to day — but multiplied across 40 machines and 12 months, it becomes the difference between a fleet that controls its costs and one that's constantly surprised by them. KPIs exist to close exactly this gap.
Without KPIs
Breakdowns feel random, budgets are guessed, and the same machine fails three times before anyone asks why.
With KPIs
Every failure pattern is visible, budgets are backed by 12 months of real data, and repeat failures get flagged early.
The 12 KPIs, Grouped by What They Tell You
Tracking 12 numbers at once is overwhelming unless they're organised by purpose. These metrics fall into four groups — reliability, speed, discipline, and cost — and together they give a complete picture of fleet health.
1. MTBF — Mean Time Between Failures
Total operating hours ÷ number of failures. Higher MTBF means fewer breakdowns. Target above 800 hours for excavators.
2. Equipment Availability
MTBF ÷ (MTBF + MTTR) × 100. World-class fleets sit above 95%; average Indian fleets run 72-78%.
3. Breakdown Rate
Number of unplanned failures per asset per month. Rising breakdown rate signals PM gaps before MTTR even moves.
4. MTTR — Mean Time to Repair
Total repair time ÷ number of repairs. Best-in-class operations hit 4-6 hours versus a 12-18 hour average.
5. First-Time Fix Rate
Jobs resolved on the first visit ÷ total jobs. Below 80% points to missing parts or incomplete diagnosis.
6. Work Order Backlog Age
Open work orders older than 30 days flag understaffing, missing parts, or unclear job priorities.
7. PM Compliance Rate
PMs completed on schedule ÷ total PMs due. The single highest-leverage KPI — target above 95%.
8. Inspection Completion Rate
Daily walk-around and pre-use inspections completed ÷ inspections required. Feeds directly into safety audits.
9. Planned vs Unplanned Ratio
Share of maintenance hours that were scheduled versus emergency. Target 80:20; Indian average runs near 55:39.
10. Cost Per Asset
Total maintenance spend per machine per month. Flags which assets are quietly draining the budget.
11. Downtime Cost
Idle hours × estimated cost per hour (EMI, rental backfill, schedule penalty). Converts hours into rupees leadership understands.
12. OEE — Overall Equipment Effectiveness
Availability × Performance × Quality. World-class is above 85%; typical fleets sit at 60-65%.
See All 12 KPIs on One Live Dashboard
HVI calculates MTTR, PM compliance, availability, and cost per asset automatically from your work orders and inspections — no spreadsheet compiling at month end.
Where Your Fleet Stands — Benchmark Scorecard
Use this scorecard to position your fleet honestly. Most Indian infrastructure fleets start in the average column — the goal is steady movement toward world-class, not an overnight jump.
| KPI | Industry Average | World-Class Target |
|---|---|---|
| PM Compliance | 60-80% | 95%+ |
| MTTR | 12-18 hours | 4-6 hours |
| Equipment Availability | 72-78% | 92%+ |
| First-Time Fix Rate | 65-75% | 90%+ |
| Planned vs Unplanned Ratio | 55:39 | 80:20 |
| OEE | 60-65% | 85%+ |
A Realistic Path: Start With Three, Not Twelve
Trying to track all 12 KPIs from day one usually fails — data quality isn't there yet and teams get overwhelmed. The fleets that succeed build up in stages.
PM Compliance + Inspection Rate
Fix the discipline layer first. This alone typically cuts reactive work orders by 25-35% within 6-9 months.
MTTR + Equipment Availability
Once PM is stable, measure how fast you recover from failures and how much uptime that translates into.
Cost Per Asset + Downtime Cost
With reliable operational data, layer in financial KPIs that justify budgets and replacement decisions.
Frequently Asked Questions
Which fleet maintenance KPI should an infrastructure manager track first?
How is MTTR calculated and why does it matter for EPC fleets?
What is a good equipment availability percentage for a construction fleet?
Can HVI track all 12 KPIs automatically without manual spreadsheet work?
How often should infrastructure managers review maintenance KPIs?
Stop Guessing. Start Measuring Your Fleet's Real Performance
Track PM compliance, MTTR, availability, and cost per asset on one live dashboard — built for JCB, Tata Hitachi and mixed EPC fleets across India.