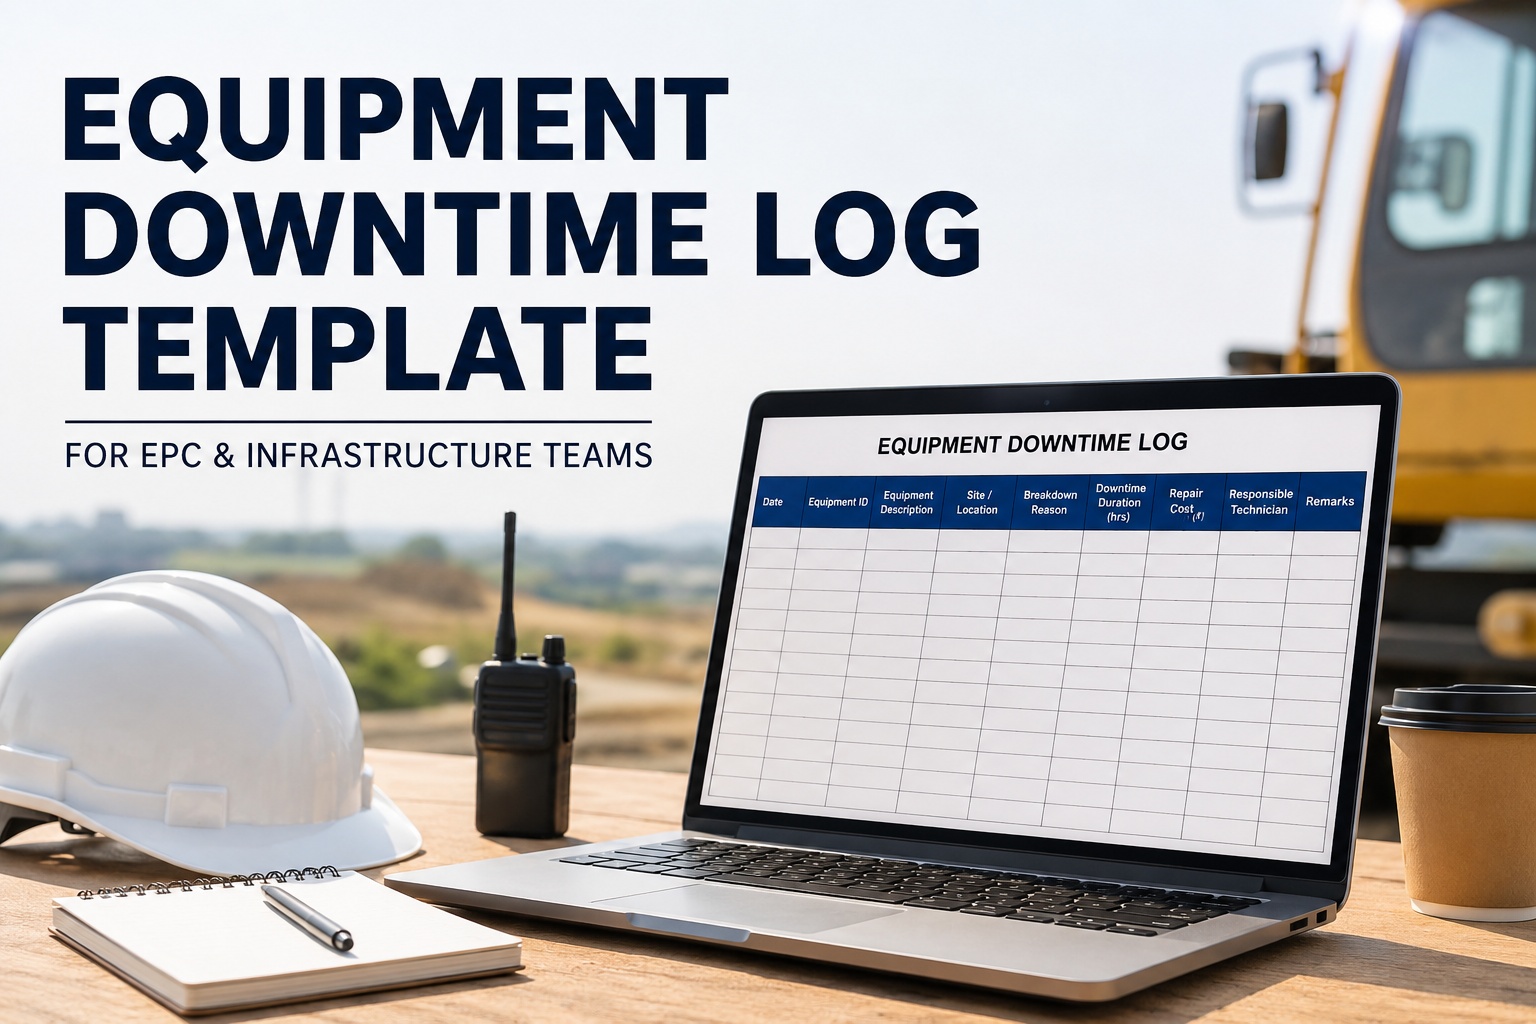
For an EPC fleet running 50+ machines, every breakdown costs money — not just the repair, but the stopped dumpers, paused earthwork, idle operators, and missed milestones. Tracking downtime properly is the #1 thing that separates a 96% availability fleet from an 82% one. This page gives you a ready-to-use equipment downtime log template for Indian EPC, mining, and infrastructure projects — covering breakdown reason, duration, repair cost, lost productivity, and responsible technician for every incident. Print it for the workshop wall, or run it digitally on HVI to track every machine across all sites automatically. Open your free HVI account to digitise this log in 10 minutes.
Equipment Downtime Log Template for EPC & Infrastructure Teams
Print-ready downtime tracking sheet covering breakdown reason, duration, ₹ cost, and responsible technician — built for Indian EPC, mining, and infrastructure fleets running across multiple sites.
The Complete Downtime Log Template
Below is the workshop-ready downtime log. Each row captures one breakdown incident — when it happened, why, who fixed it, how long the machine stayed down, what it cost in repair, and the lost productivity value. Get the digital version free to auto-track all of this without paperwork.
Day Shift
Cause Code Reference Card
Use these standard codes in the CAUSE CODE column above. Standardised codes make root-cause analysis possible at week-end. Book a demo to see HVI auto-tag every downtime entry with the right code based on the defect type logged.
Coolant overheating, oil leaks, engine warning, starter failure, alternator issues.
Hose burst, cylinder seal failure, hydraulic oil contamination, pump pressure drop.
Battery dead, wiring damage, sensor failure, dashboard fault, lights or beeper out.
Track snap, sprocket wear, roller seal leak, final drive failure (excavators & dozers).
Bucket teeth broken, blade wear, drum bearing (compactors), screed heater (pavers).
Operator error, fuel out, missed PM, no operator available, awaiting clearance.
Weather stoppage, site access blocked, no material to load, power failure at site.
Scheduled PM1/PM2/PM3, planned tyre rotation, oil change, hydraulic flush.
Stop Logging Downtime on Paper — Get Root-Cause Insights in 1 Click
HVI auto-captures every breakdown with timestamp, photo, cause code, repair cost, and lost productivity. Weekly root-cause reports auto-generate. Mechanics get notified instantly.
Weekly Downtime Summary — Roll-Up Card
At week-end, roll up your downtime entries into this summary. This is what your Project Manager and COO need to see for fleet health review.
Impact Tier Reference — How to Mark IMPACT Column
Mark every downtime entry with one of these impact tiers based on how much it affected production. Helps your COO spot critical incidents at a glance. Sign up free — HVI auto-classifies impact tier based on downtime duration and lost ₹.
> 8 hours down
OR ₹1 lakh+ lost
Stops earthwork chain · multiple dumpers idle · milestone risk
4–8 hours down
OR ₹40K–₹1L lost
Single excavator out · partial shift loss · 2–3 dumpers idle
1–4 hours down
OR ₹10K–₹40K lost
Minor breakdown · contained to one machine · same-day fix
< 1 hour down
OR < ₹10K lost
Minor adjustment · operator-fixed · no production impact
Excel Downtime Log vs HVI Digital — The Real Difference
Paper and Excel logs work for the first 20 entries. Past that, they collapse. Book a 30-minute demo to see how HVI handles 500+ downtime entries a month without anyone touching a spreadsheet.
Expert View — From a Workshop Head
We started using a paper downtime log in 2022. By 2024 we had 14 spiral notebooks and not one usable insight from them. We couldn't even tell which machine cost us the most last quarter. After moving to HVI in early 2025, every breakdown is logged in real time with cause code, photo, and ₹ impact. The weekly summary auto-generates. In 8 months, we identified that one batch of Tata Hitachi machines had a recurring hydraulic seal issue — got OEM to replace under warranty, saved ₹14 lakh. That single insight paid for HVI for 5 years.
Conclusion — A Downtime Log Is Only Useful If You Can Analyse It
Filling out a downtime log on paper is the easy part. The hard part — and the part that actually saves money — is rolling up 100 entries into one weekly insight, spotting the recurring failure pattern, and acting on it before it costs another lakh. Paper logs sit in a drawer. HVI logs sit on your COO's dashboard, ready to drive decisions. Book a 30-minute demo to see how HVI turns daily downtime entries into weekly insights without anyone touching Excel.
Turn Every Breakdown into a Lesson — Not Just a Log Entry
Indian EPC, mining, and infrastructure contractors use HVI to capture every breakdown with cause code, photo, ₹ impact, and responsible technician. Weekly root-cause reports auto-generate. COOs see fleet health live. Workshops get rid of paper notebooks forever.