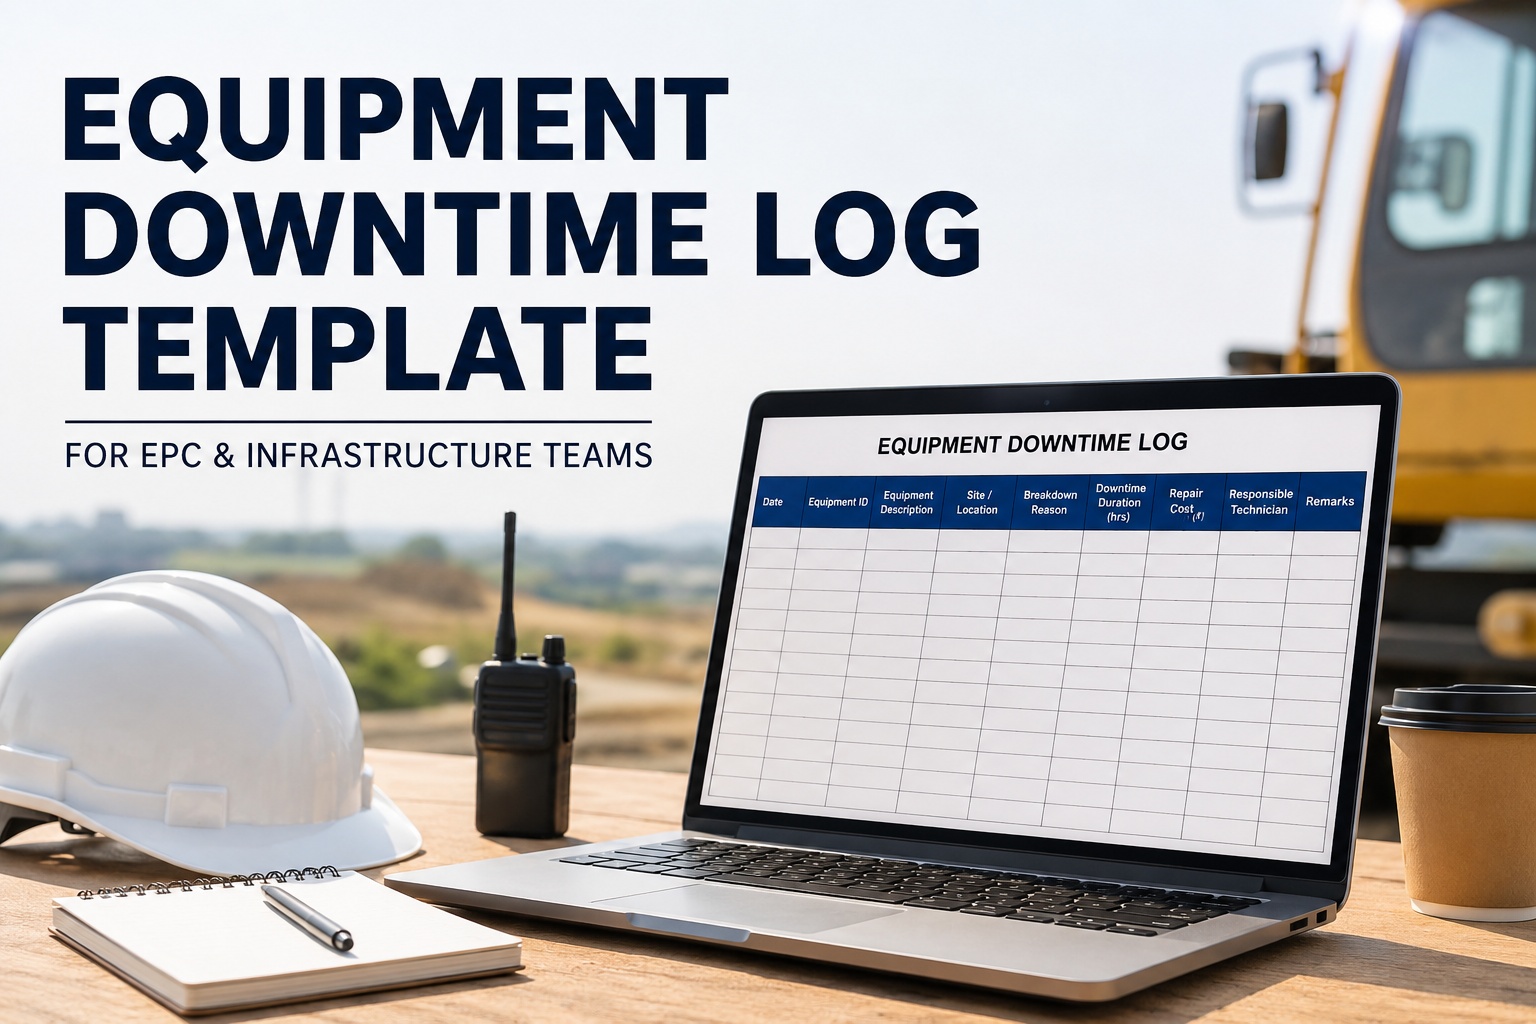
A heavy machine that sits idle for 4 hours a day is no different from a salary expense that walks out unused. On Indian construction, highway, and mining sites, the gap between owning equipment and earning from it sits in one number: utilization rate. A clean, easy-to-use equipment utilization report turns that number from a guess into a measured fact. This page gives you a ready-to-use template covering operating hours, idle time, downtime reasons, utilization rate and productivity tracking, built around the way Indian EPC contractors actually run JCB, L&T Komatsu, BEML and TATA Hitachi fleets. Start free with HVI to digitise utilization across your whole fleet.
Equipment Utilization Report Template: Track Hours, Downtime & Idle Time
A complete daily utilization format for Indian sites. Operating hours, idle time, downtime by reason, utilization percentage, and a fleet-wide leaderboard. Built for fleets of 10 to 500 machines.
- Operating 12h
- Idle 4h
- Downtime 2h
- No-shift 6h
Typical utilization range of Indian construction equipment fleets
Target utilization for mining and 24×7 highway packages
Utilization gain typically saves Rs 8–12 L per year per excavator
Reporting frequency expected by NHAI, NHIDCL, CIL clients
The Utilization Math, Made Simple
Three numbers tell the full story of any machine. Get these three right and you can run a 500-machine fleet on one screen.
Utilization %
How much of the scheduled shift the machine actually worked.
Availability %
How much of the shift the machine was ready to run, ignoring idle.
Productivity %
How much of the full day the asset was earning, regardless of shift.
24-Hour Time Allocation Visual
Every machine on every site has its day broken into four buckets. Stacking them on a single bar tells the story at a glance. Here is what a healthy excavator day looks like.
Bring this view to every machine in the fleet and the wasted hours become impossible to hide. Book a 30-minute demo to see live 24-hour bars on real Indian site data.
Sample Daily Equipment Utilization Report
This is the standard daily utilization report format used on Indian highway and mining sites. One row per machine, one column per metric. Roll it up to weekly, monthly, or per-package as needed.
| Machine | Sched | Operate | Idle | Down | Util % |
|---|---|---|---|---|---|
| EX-07 / PC210 | 16 | 12 | 2.5 | 1.5 | 75% |
| JCB-03 / 3DX | 10 | 8 | 1.5 | 0.5 | 80% |
| DZ-02 / BD80 | 16 | 9 | 5 | 2 | 56% |
| TIP-22 / Signa | 16 | 13 | 2 | 1 | 81% |
| TM-04 / AM7 | 10 | 6 | 3 | 1 | 60% |
| CR-05 / 750T | 10 | 4 | 2 | 4 | 40% |
The CR-05 crane at 40% is the first conversation in the next morning meeting. Get the HVI utilization report free on your phone today.
Fleet Utilization Leaderboard
The leaderboard is the single most powerful behaviour-change tool in fleet management. Once every site manager can see where their machines rank, the bottom of the list starts climbing.
| Rank | Machine | Utilization | % |
|---|---|---|---|
| 1 | TIP-22 / Signa | 81% | |
| 2 | JCB-03 / 3DX | 80% | |
| 3 | EX-07 / PC210 | 75% | |
| 4 | TM-04 / AM7 | 60% | |
| 5 | DZ-02 / BD80 | 56% | |
| 6 | CR-05 / 750T | 40% |
Top Downtime Reasons — Pareto Analysis
80 percent of downtime almost always comes from 4–5 root causes. Tracking each downtime entry with a reason code turns the report into an action plan, not just a record.
Once you can see the top 2 reasons clearly, you can fix them. A 5% drop in breakdown downtime alone lifts fleet utilization by 1.5 to 2 points. Book a HVI demo to see your live downtime Pareto on real fleet data.
Expert View from the Field
We run 86 machines across three NHAI packages. For two years our daily utilization was tracked on paper sheets that reached me on Friday evening for the whole week. By then it was too late to fix anything. Average fleet utilization was stuck around 58 percent.
Once we put utilization on HVI with operator-side updates and a live leaderboard visible to all four site managers, the competitive pressure alone pushed the average from 58 percent to 71 percent in . That is roughly 18 extra productive hours per machine per week. The numbers spoke louder than any review meeting.
Sandeep Reddy, Plant & Machinery Head, Highway EPC Contractor, Andhra Pradesh — 86 machines across 3 NHAI packages
Paper Utilization Tracking vs HVI Digital Utilization Report
- ×Numbers reach the manager 3–5 days late
- ×Idle time almost never logged honestly
- ×Downtime reasons missing or vague
- ×No fleet-wide leaderboard view
- ×Weekly roll-up is a manual Excel exercise
- ✓Live numbers, available by shift end
- ✓Idle vs operating split captured automatically
- ✓Downtime reason codes enforced at entry
- ✓Fleet leaderboard live on every site head's phone
- ✓Daily, weekly, monthly roll-up in one click
For Indian EPC, mining, and infrastructure fleets running 20+ machines, digital utilization tracking pays back its setup cost in the first quarter through visible behaviour change. Sign up free with HVI and bring every machine onto one utilization dashboard.
Frequently Asked Questions
What is a good utilization rate for Indian construction equipment?
Most Indian construction equipment fleets run at 55 to 70 percent utilization on average. Highway and mining packages running 24×7 shifts target 75 to 85 percent. Anything below 50 percent for a critical machine like an excavator or dozer points to either site planning issues, breakdown problems, or operator unavailability. The exact target depends on contract type, terrain, and shift pattern.
What is the difference between utilization, availability, and productivity?
Utilization is operating hours divided by scheduled hours, showing how much of the planned shift the machine actually worked. Availability is scheduled minus downtime divided by scheduled, showing how much of the shift the machine was ready to run. Productivity is operating hours divided by 24, showing the machine's full-day earning ratio. All three are useful and they tell different stories about the same machine.
Should idle time be counted as operating hours?
No. Idle time, when the engine is running but the machine is not doing productive work, must be tracked separately. Counting idle as operating inflates the utilization number and hides fuel waste, operator behaviour issues, and site sequencing problems. Most modern hour meters and telematics systems on JCB, L&T Komatsu, CAT, and TATA Hitachi equipment split engine-on time into working and idle automatically.
How often should utilization reports be reviewed?
Best practice on Indian sites is daily review at the morning meeting, weekly review by the project manager, and monthly review at the head office. The daily review catches outliers like the CR-05 crane at 40 percent the day after it happens. The weekly review spots trends. The monthly review feeds asset deployment and procurement decisions. HVI auto-generates all three roll-ups from the same operator-side entry.
Can a utilization report help with EPC client billing?
Yes. Many NHAI, NHIDCL, Coal India, and metro authority contracts have equipment standby and utilization-linked clauses. A clean, photo-verified daily utilization report becomes the supporting document for standby claims, idle hour disputes, and monthly reconciliation with the client. The same HVI report that runs internal performance reviews also serves as the evidence pack for client-facing claims.
Run Every Machine on One Live Utilization Dashboard
HVI captures operating hours, idle time, and downtime reasons live from the operator's phone. Auto-built utilization donut, 24-hour bar, fleet leaderboard, and Pareto. Daily, weekly, monthly roll-up in one click.
No credit card. No hardware. Live on your fleet in under 10 minutes.