Your fleet head's Monday morning ritual is opening 6 Excel files, 3 WhatsApp groups and the workshop supervisor's phone to answer the question every CEO asks — "how did last week actually go?" — and by the time the answer is stitched together, it is already Wednesday and the numbers are stale. HVI Maintenance Dashboard replaces that ritual with one live view showing cost per asset per hour, defect trend by asset class, PM adherence per site and MTBF trending across every OEM in your fleet — all updating in real time as WOs close and inspections complete. Purpose built for Indian HEMM fleets across excavators, dumpers, tippers, cranes and DG sets, deployed in weeks, and you can start a 14 day free trial to see your first live dashboard within hours of onboarding.
See Every Fleet Cost And Defect Trend In One Maintenance Dashboard
Live cost per asset per hour, defect trending, PM adherence and MTBF across every OEM in your fleet. Purpose-built for Indian HEMM — excavators, dumpers, tippers, cranes, DG sets. Deploy in weeks.
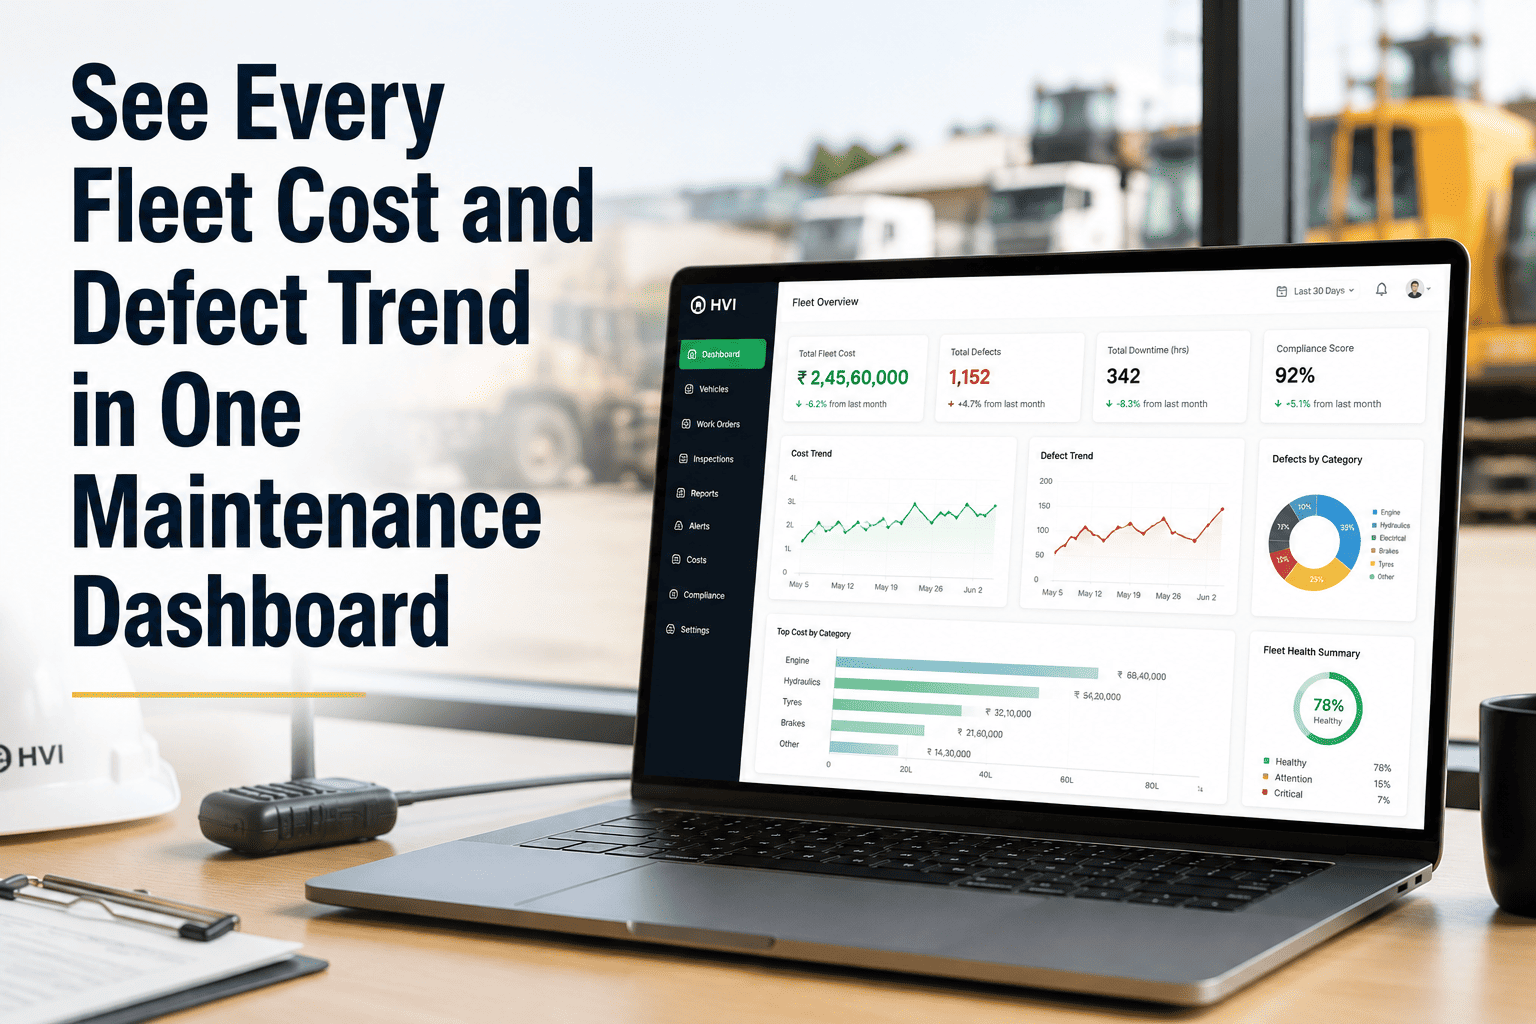
The Full Dashboard Anatomy
This is what your fleet head sees at 9 AM Monday. Every KPI live, every widget drillable, every trend clickable to the source WOs and inspections.
6 Reports That Change How You Run The Fleet
These are the six reports Indian fleet heads open every Monday morning. Each one surfaces decisions that were previously invisible in paper-era operations.
Cost Per Asset Per Hour
The single most important fleet KPI. Shows which assets are eating budget disproportionately. Drill into any asset to see the WOs and parts driving the cost.
Defect Trending By Asset Class
Which asset classes are surfacing more defects this quarter vs last. Pattern detection surfaces systemic issues before they become production events.
PM Adherence Per Site
Plan vs actual PM completion for every site. Deferrals flagged with reason codes. Site heads accountable for adherence targets.
MTBF Trending
Mean time between failures by asset, by class, by OEM. Rising MTBF means the plan is working. Falling MTBF triggers intervention.
Parts Consumption Trend
Which SKUs are being consumed faster or slower than forecast. Surfaces stockout risk 30 days early and overstock risk 60 days early.
Workshop Cycle Time
Average WO cycle time by mechanic, by workshop, by defect type. Highlights bottlenecks and workshop capacity constraints before they cascade.
See Your Own Fleet Live On The Dashboard This Week
Start a 14-day free trial and upload your fleet. Within the first day the dashboard begins populating with your live data. By day 7 you have a full week of cost per asset, defect trend and PM adherence numbers you can act on.
Purpose-Built Views For 5 Fleet Roles
The same underlying data serves five different personas, each with a purpose-built view that surfaces only what they need to act on.
Cost per asset per hour, uptime by site, top 5 cost-driving assets, MTBF trend by OEM. One-click drill to any underlying WO.
Open WOs for this site, PM adherence, critical defects, asset availability for tomorrow's shift plan. Focused on action, not summary.
WO board, mechanic workload balance, parts availability against open WOs, cycle time trend for the workshop.
Maintenance spend vs budget by project, cost per asset for depreciation planning, GST-ready vendor spend, ERP-ready cost exports.
Safety-critical defect trend, DGMS-ready registers, incident CAPA closure, near-miss tracking with photo evidence.
Every Number Drills Down To The Source
Dashboards are only useful when you can drill from the headline number to the underlying transaction. HVI's drill flow makes every KPI investigatable in seconds.
Fleet KPI
See "Cost per asset per hour = Rs 340". Ask why it went up 8 percent this month.
Asset Class
Drill in. Dumpers are Rs 520 per hour, 60 percent higher than any other class this month.
Specific Asset
Drill in. DZ-11 CAT 793F cost Rs 1.2L this month, 4x the fleet average for dumpers.
Source WOs
See the actual WOs, parts, labour hours and defect notes. Root cause visible in seconds.
Data In · Data Out
HVI pulls from your existing telematics and pushes clean cost data into your ERP. No isolated systems, no duplicate entry.
Telematics
Engine hours, fuel, location and DTCs from major Indian and global telematics providers via API sync.
OEM ECU
Direct ECU data from CAT, Komatsu, Volvo where available. Hour meter, alerts and fault codes ingest natively.
SAP & Oracle
Closed WO costs, parts consumption and vendor invoices push to enterprise ERP cost centres via REST API.
Tally & DGMS
Tally XML export for finance reconciliation. DGMS monthly returns auto-generated from live inspection and WO data.
Frequently Asked Questions
Every Fleet KPI. Every Trend. One Live Dashboard.
HVI Maintenance Dashboard is live on Indian construction, mining and infrastructure fleets from 20-machine yards to 500+ asset enterprise operations, replacing Monday morning Excel rituals with real-time cost, defect, PM and MTBF visibility. Start a 14-day free trial or book a walkthrough with our team.