Your spares and repair budget went up 18% this quarter, and the monthly report says exactly that — one number, trending the wrong way, with nothing underneath it. Every fleet manager has stared at a total like this and had the same unanswerable question: is this spread evenly across the fleet, or is one machine quietly doing most of the damage? A fleet-wide total can't tell you, because averaging is exactly what hides the answer. The only way to find out is to drill down — from the total, to cost per machine, to the one asset that's actually driving the number — and once you're there, the next decision usually answers itself. Here's how that drill-down works in practice, and how HVI builds it automatically from your existing work orders.
Maintenance Costs Growing but You Can't Find Why?
A fleet-wide total tells you costs are rising. Asset-level analytics tells you which machine is causing it — and whether that machine is still worth repairing.
The Drill-Down: Three Levels Deep
Most fleets stop at the first level. The answer usually sits at the third.
Level 1
Fleet-Wide Total
Total maintenance spend for the quarter, up 18% year over year. True, but useless on its own — it tells you something changed without telling you what or where.
Level 2
Cost Per Machine
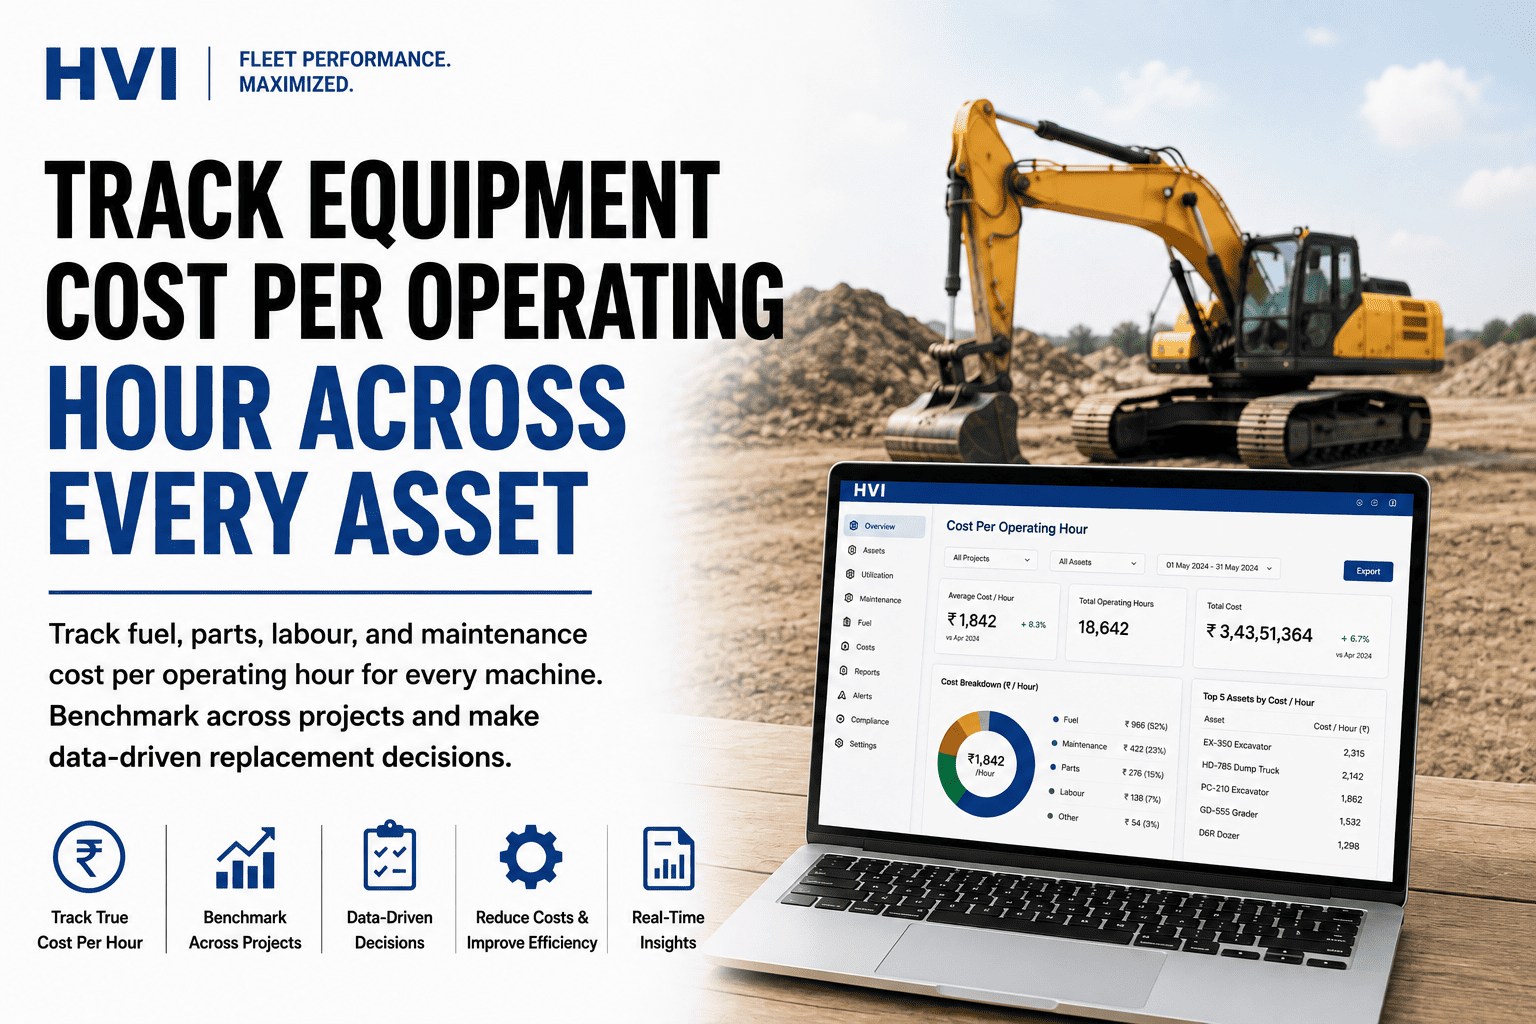
The same total broken out across every asset in the fleet, ranked from highest to lowest spend. This is where the pattern usually becomes visible — a handful of machines carrying most of the increase while the rest sit near their normal baseline.
Level 3
Single-Asset Cost Trend
The specific excavator, loader, or dumper responsible, with its cost per hour plotted over time — showing not just that it's expensive, but whether the trend is a one-off repair or a genuine climb that keeps repeating quarter after quarter.
See your own fleet's cost ranked machine by machine, and find out which one is actually driving your budget up.
A Worked Example: The Excavator Eating 40% of the Budget
Take an eight-machine excavator fleet where quarterly spares and repair spend rose from ₹9.2 lakh to ₹10.9 lakh — an 18% increase fleet-wide. Broken down by machine, the picture changes completely.
| Asset | This Quarter | Fleet Average | Share of Increase |
|---|---|---|---|
| EX-04 | ₹4,10,000 | ₹1,36,000 | ~40% |
| EX-07 | ₹1,55,000 | ₹1,36,000 | ~9% |
| Remaining six machines | ₹5,35,000 combined | ~₹89,000 each | Near baseline |
One machine, EX-04, accounts for roughly 40% of the entire quarter's increase. The other seven are close to normal. Without drilling to this level, the 18% fleet-wide rise would have triggered a budget conversation about the whole fleet, when the real conversation is about one asset.
Once You've Found the Machine: Repair or Replace?
Industry practice leans on a simple threshold once a single asset's cost trend is isolated — though the trend matters as much as the number itself.
The 50% Rule
When a machine's annual repair and maintenance cost approaches half of its current replacement value, most fleets treat that as the point where continuing to repair costs more than it saves.
The Trend Signal
A single expensive quarter can be a one-off failure. Cost per operating hour rising across three consecutive reporting periods is the stronger signal — it means the machine's baseline has shifted, not just had a bad month.
The Downtime Cost
Repair costs alone understate the picture — a machine that's also spending more days in the workshop is costing the fleet in lost hours on top of the repair bill itself.
Why Fleets Get Stuck at the Fleet-Wide Total
Costs aren't tagged to assets
Parts and labor often get logged against a general maintenance account rather than a specific machine, so there's no per-asset number to rank in the first place.
The report only shows one period
A single quarter's number can't show a trend — three consecutive periods of rising cost is the actual signal, and that requires a report built to compare periods, not just report one.
Nobody has time to build the ranking manually
Sorting eight, twenty, or fifty machines by cost from a spreadsheet is possible but rarely gets done consistently enough to catch a shift while it's still small.
The replacement value isn't tracked either
Without a current value on record for each asset, there's no way to check a repair bill against the 50% threshold — the comparison never even gets made.
Frequently Asked Questions
Do we need to already track costs per asset to use this kind of drill-down?
You don't need a perfect starting point — once parts and labor from work orders are tagged to a specific machine going forward, a usable per-asset ranking builds within the first full reporting period, even if past records were only tracked at the fleet level.
How is the 50% replacement threshold actually calculated?
It compares the machine's trailing annual repair and maintenance cost against its current market or replacement value, so the figure updates as both the machine ages and repair costs accumulate, rather than being a one-time calculation.
What if the high-cost machine is only expensive this one quarter?
A single expensive quarter is often a one-off major repair rather than a genuine trend, which is why the three-period rising-cost signal matters more than any single quarter's total before a replace decision gets made.
Can this integrate with our SAP, Oracle, or Tally cost data?
Yes — asset-tagged cost data syncs with these systems, so the per-machine ranking and trend views draw from the same figures your finance team already reconciles against.
How quickly can we see our own fleet's cost ranking?
Once work orders are tagged to assets, a full per-machine ranking is available within the first month of data; sign up free to see your fleet's numbers build from day one.
Find the One Machine Behind the Number
An 18% cost increase is a fleet-wide symptom. The cause is almost always one or two specific machines, and the only way to find them is to drill past the total. Start free and see your fleet ranked by cost per asset, or bring last quarter's spend to a 30-minute session with our India team.