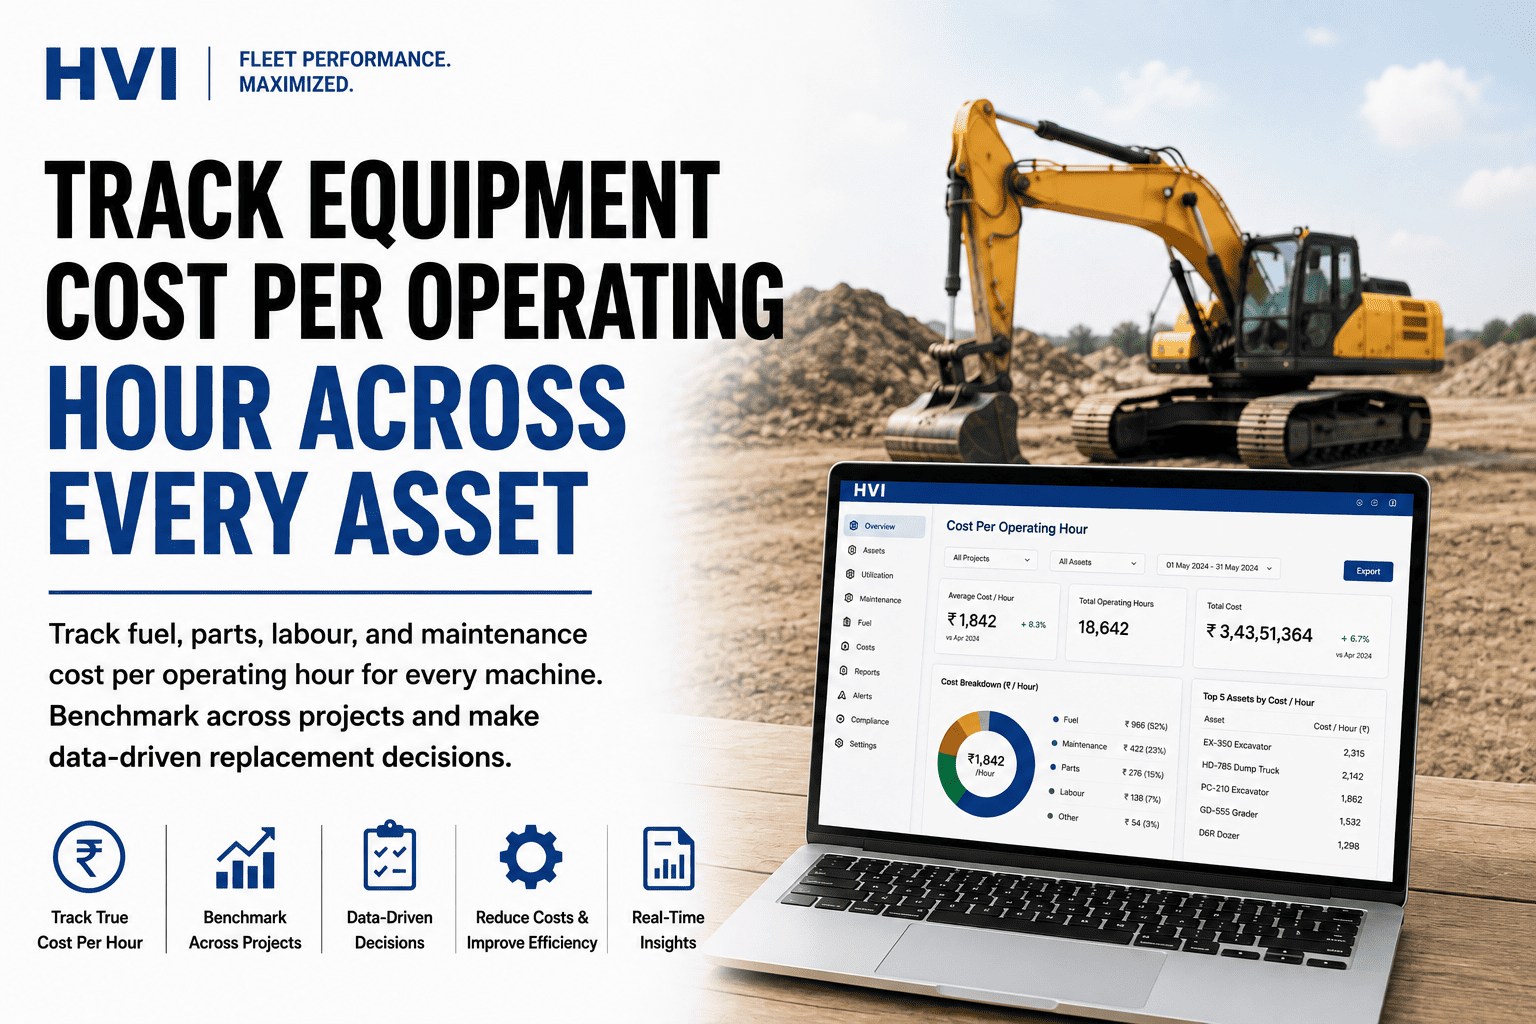
Ask what a machine earns and every fleet owner answers in seconds; ask what it costs per hour to keep running and the room goes quiet. Fuel sits in the diesel register, parts in store ledgers, labour in muster rolls — so the old excavator burning ₹900 an hour against its twin's ₹520 keeps getting dispatched like any other machine, quietly eating ₹7 lakh a year that no fleet-average report will ever show. That one number changes every decision it touches: which units take the long-duty sites, when a repair stops making sense and replacement begins, whether owning still beats hiring, and what rate actually carries a margin on the next tender. HVI merges those drawers into one live ₹/hour figure per asset — fuel entries, parts issued to work orders, labour booked per job, and daily meter readings, assembled automatically for every JCB, Tata Hitachi, BEML, Komatsu, Volvo, and SANY machine across all your sites — sign up free and see your first machine's true cost this week.
Know Exactly What Each Machine Costs Per Operating Hour
Fuel, parts, labour, and outside repairs — merged into one live ₹/hour figure per asset, benchmarked across projects, and ready for repair-versus-replace decisions backed by data instead of instinct.
What Sits Inside One Operating Hour
A typical 20-tonne excavator on an Indian site costs ₹1,400–₹2,000 per operating hour all-in. Here is how that hour splits — and why tracking only one slice, as most fleets do, hides the real picture.
Fuel gets watched because the diesel bill is loud. Parts, labour, and outside repairs leak silently across registers — which is exactly where badly maintained machines hide their excess cost. Only the merged number exposes them.
Same Model. Same Site. Very Different Bills.
Three Tata Hitachi EX 210s on one mining project, last quarter's maintenance cost per hour (parts + labour + outside repairs, excluding fuel):
Unit 3 costs ₹365 more per hour than its twins — roughly ₹7 lakh extra per year at normal utilisation, invisible in a fleet-average report. Per-machine cost tracking is how you find it in week one instead of year three.
Four Streams In. One Number Out. Zero Retyping.
See Your Costliest Machine — Computed Live From Your Data
Bring last quarter's parts and repair records for two or three machines to a 30-minute session. Our India team loads them, computes each unit's cost per hour in front of you, and shows the dashboard that keeps the number live from daily work — no retyping, no month-end reconciliation.
The Trend Tells You When to Stop Repairing
Unit 3's maintenance cost per hour over six months — the curve every ageing machine eventually draws:
When a machine's maintenance cost per hour crosses 60–70% of the hourly cost of hiring or financing its replacement — and the trend is still climbing — every further repair is buying time, not value. That decision needs the trend, the machine's full cost history, and its resale position, all of which the system holds ready the day you ask.
Decisions This One Number Unlocks
| Decision | What the ₹/hr Data Shows | Typical Outcome |
|---|---|---|
| Repair vs replace | Cost trend vs replacement-equivalent hourly cost | Replace 1–2 chronic units; fleet cost/hr drops immediately |
| Deploy vs park | Which units to send to long-duty sites | Cheapest-to-run machines take the high-hour work |
| Own vs hire | True owning cost against market hire rates | Hire decisions made on data, not the vendor's pitch |
| Rate quoting | Actual cost base per machine class | Project rates carry real margins, not guessed ones |
| Maintenance ROI | Cost/hr before and after PM discipline | The 10–15% yearly drop that proves the program pays |
Frequently Asked Questions
What should be included in cost per operating hour?
At minimum: parts, workshop labour, and outside repair bills over machine hours — that is the maintenance cost per hour used for repair-versus-replace calls. Add fuel, tyres, and GET for full operating cost, and ownership costs (EMI, insurance, depreciation) when comparing owning against hiring. Track the layers separately so each decision uses the right one.
How does HVI capture costs without extra data entry?
The inputs are by-products of normal work: parts issued against work orders, fitter hours booked on jobs, fuel entries per machine, and meter readings from daily operator inspections. Nobody fills a cost sheet — the number assembles itself, and syncs to SAP, Oracle, or Tally for accounts.
Can we compare machines across different sites and projects?
Yes — that is the point of dividing by operating hours: a Dhanbad mine unit and a Mumbai metro unit become directly comparable per hour, with filters by model, site, age band, and month. Outliers surface in the ranking within the first month of data.
How much history do we need before the numbers mean anything?
One month gives a usable per-machine figure; a quarter gives trends solid enough for deployment and hire decisions; two to three quarters support replacement calls. Past paper records can be imported as opening history if you want a head start — sign up free and begin the clock this week.
We run mixed fleets — HEMM, tippers, and DG sets. Does one system cover all?
Yes — every asset with a meter (hours or kilometres) gets the same treatment, from excavators and dumpers to tippers, cranes, and DG sets, with class-wise benchmarks so you compare like with like. See it on your own asset list in a live session: book a 30-minute demo.
Every Machine Has a Number. Most Fleets Never See It.
Your registers already contain every rupee and every hour — they just never meet. Put them on HVI and the cost per operating hour computes itself for every asset: the chronic units surface in weeks, deployment and hire decisions get a data floor, project rates get a real cost base, and replacement calls stop being arguments. Start free and load your first machines today, or bring two machines' records to a 30-minute session and leave knowing which one is quietly eating your margin.