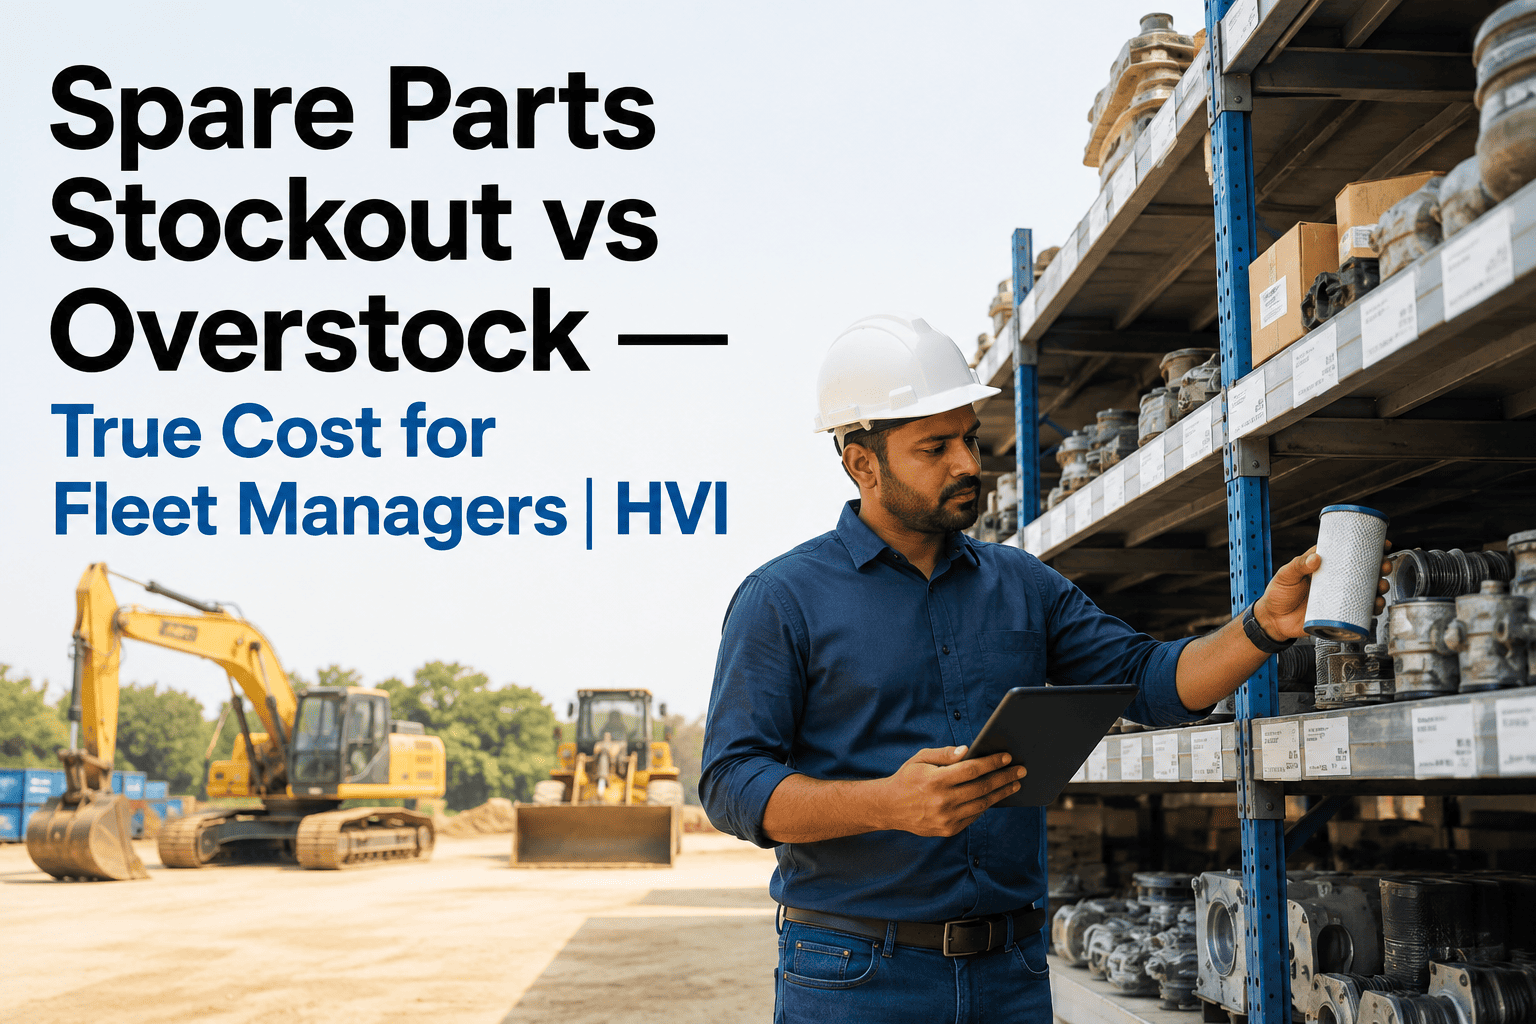
Every fleet head has been in this meeting: finance says parts spend is up 22 percent, workshop says half the PMs got deferred for parts stockouts, and the storekeeper insists nothing has changed. All three are right, and the reason they are all right is that stockout and overstock are two sides of the same broken forecasting problem — most Indian fleets solve neither because their tools were built for one warehouse and one product line, not for 50 HEMM assets scattered across 4 sites. This piece walks through the real INR costs of both failure modes, why they compound each other, and the specific fix that solves both at once. If you want the fix running on your own fleet, you can start a 14 day free trial and see live consumption trends and reorder logic on your parts master within the first day.
Spare Parts Stockout Vs Overstock: What It Really Costs Fleet Managers
Real workflows, real INR numbers, and why the two failure modes compound each other on Indian construction, mining and infrastructure fleets — written for maintenance and finance leaders who want the mechanism.
Both Sides Cost You. Both Sides Are The Same Problem.
Stockouts and overstock look like opposite problems, so most fleets try to solve them with opposite fixes — order more to fix stockouts, order less to fix overstock — and end up trapped in an oscillation that costs money in both directions. The real problem underneath both is the same: forecasting is done by storekeeper intuition instead of consumption data, safety stock levels are guessed instead of calculated, and inter-site transfers do not happen because sites do not see each other's stock. Fix the underlying data problem and both symptoms disappear together. This piece walks through the specific costs of each side and the fix that addresses both.
Side By Side · Where Each Side Costs You
The specific INR cost drivers behind each failure mode. Add them up and 12 to 18 percent of a typical Indian fleet's parts budget is going out the door every year, unnecessarily.
Missing The Part When You Need It
A stranded haul truck at Rs 15,000 to 2 lakh per hour of production loss. One 6 hour stockout event can outstrip a year of that part's stock cost.
Urgent parts from local aftermarket vendors cost 2 to 3 times normal price. Air-freight for OEM parts adds another 30 to 50 percent.
Aftermarket substitutes bought in emergency may void OEM warranty on major components. One warranty denial dwarfs any stock saving.
One stranded asset backs up dependent operations — a stranded paver stops 15 tippers and a batching plant. Cost multiplies across the shift.
Buying More Than You Need
Every rupee sitting in surplus stock is a rupee not funding operations. Cost of capital plus opportunity cost typically runs 12 to 15 percent annually.
Oil, coolant, filters and rubber components expire on shelf. Overordered stock past shelf life is a full write-off with no recovery value.
Overstock takes storage space, handling labour and physical audits. Storage cost typically 3 to 5 percent of held stock value per year.
Assets get retired or transferred. Parts held for those assets become obsolete overnight. Enterprise fleets discover this at year-end audit consistently.
The Real INR Impact Per Asset Per Year
Sample numbers for a typical Indian HEMM fleet running mixed OEM equipment. Actual figures vary by fleet size, asset mix and site geography but the ratios stay remarkably consistent.
| Cost Bucket | Failure Mode | Small Fleet (20 assets) | Mid Fleet (100 assets) | Large Fleet (500 assets) |
|---|---|---|---|---|
| Unplanned downtime | Stockout | Rs 8-12 L | Rs 40-60 L | Rs 2-3 Cr |
| Emergency procurement premium | Stockout | Rs 2-3 L | Rs 10-15 L | Rs 50-75 L |
| Warranty denial exposure | Stockout | Rs 1-2 L | Rs 5-10 L | Rs 25-50 L |
| Working capital cost | Overstock | Rs 3-5 L | Rs 15-25 L | Rs 75L-1.25 Cr |
| Shelf life expiry write-off | Overstock | Rs 1-2 L | Rs 5-10 L | Rs 25-50 L |
| Storage & handling overhead | Overstock | Rs 1-2 L | Rs 5-10 L | Rs 25-50 L |
| Total Annual Loss | Combined | Rs 16-26 L | Rs 80L-1.3 Cr | Rs 4-6.5 Cr |
Calculate The Real Number On Your Own Fleet
Start a 14-day free trial and upload your parts master. HVI's consumption analytics show you exactly which parts are chronically stocked out, which are chronically overstocked, and what the combined cost is on your specific fleet within the first week.
The 5-Part Fix That Addresses Both Sides
Fleets that permanently solve stockouts also solve overstock, because both are symptoms of the same underlying data and workflow gaps. This is the 5-part fix that works on Indian HEMM fleets.
Live Consumption Data Per SKU
Every part issued gets logged against a specific WO and asset. Over 90 days, you have a real consumption baseline per SKU per site instead of storekeeper intuition. Forecasting stops being a guess.
Calculated Safety Stock By ABC Class
Class A parts (10 percent of SKUs, 70 percent of spend) get careful safety stock calculations. Class C parts (60 percent of SKUs, 5 percent of spend) get simple min-max rules. Effort matches value.
Vendor Lead Time Discipline
Every vendor's actual lead time tracked from PO to GRN. Reorder points calculated from actual lead time plus buffer, not the promised lead time on the quote.
Enterprise Stock Visibility
Every store sees every other store. Transfers happen before POs. Surplus at one site funds shortage at another. Enterprise stock levels rationalise inside 90 days.
Monthly Review Cadence
Fleet head, workshop supervisor and finance review the 5 worst stockout SKUs and 5 worst overstock SKUs monthly. Structural fixes replace one-off firefighting.
What To Prioritise This Quarter
You cannot fix everything at once. Here is the quarter-1 sequence Indian fleet managers use to attack the biggest chunks of the 12 to 18 percent loss first.
Data Foundation
Load parts master, connect consumption tracking to WOs, establish 30-day baseline. No new policies yet — just data.
ABC & Reorder Logic
Classify SKUs into A, B, C tiers. Set calculated safety stock and reorder points. Turn on auto reorder alerts.
Transfer & Review
Enable inter-site transfers. Rationalise enterprise stock. Establish monthly review cadence with fleet head and finance.
What Your OEM Will Not Tell You
Four uncomfortable truths that OEM parts sales representatives have no incentive to volunteer. Worth knowing before your next parts contract renewal.
Recommended Stock Levels Favour The OEM
OEM-recommended safety stock is calibrated to keep their parts in your stores, not to minimise your working capital. Real consumption data almost always shows you can hold 20 to 40 percent less.
Aftermarket Parts Are Warranty-Safe For Most SKUs
Warranty rules restrict aftermarket parts on specific major components, not on filters, hoses, brake pads and consumables. Cross-reference libraries let you save 30 to 50 percent on Class B parts without warranty risk.
Shelf Life Is Real And Documented
OEMs specify shelf life for oil, coolant, rubber and filter media, but almost never enforce or track it. Buying 12 months of supply on a 6-month-shelf-life SKU is a guaranteed write-off waiting to happen.
Bulk Discount Terms Are Negotiable Down
Bulk discounts assume you hit consumption targets. With live consumption data you can renegotiate quarterly instead of annually, matching actual to projected. Real savings appear inside 6 months.
Frequently Asked Questions
Reclaim 12-18% Of Your Parts Budget This Year
HVI Parts Management is live on Indian construction, mining and infrastructure fleets, replacing storekeeper intuition with real consumption data, calculated reorder logic and enterprise stock visibility. Start a 14-day free trial or book 30 minutes with our team to walk through the 5-part fix on your fleet.