Construction Equipment ROI Calculator: How Much Can You Save with Preventive Maintenance

By Alex Rowan on June 16, 2026

construction-equipment-roi-preventive-maintenance-calculator

Most construction equipment failures don't announce themselves — they build quietly over thousands of hours until a tipper breaks down mid-pour or an excavator seizes on a live highway project. At that point, the cost isn't just the repair bill. It's crane hire, labour standby, subcontractor penalties, delay damages, and the cascading schedule impact that follows. Infrastructure and fleet operators running 20+ machines typically spend 3–5 times more on reactive repairs than teams of the same size running structured preventive maintenance programmes. This page gives you the real numbers — what breakdowns actually cost across machine types, what PM actually costs to run, and what the ROI gap between the two looks like at your fleet size. Start tracking your fleet on HVI free or book a 30-minute demo to see the PM tracking tools in action.

Construction Equipment · Preventive Maintenance ROI · 2026

How Much Is Reactive Maintenance Costing Your Fleet Right Now?

Real cost data across tippers, excavators, cranes, and transit mixers — showing the actual ROI gap between breakdown-first and prevention-first maintenance strategies.

3–5× Higher cost of reactive vs preventive maintenance per machine hour
₹18–42L Average annual breakdown cost per heavy machine on reactive-only programmes
67% Of unplanned breakdowns could be prevented with a structured PM schedule

The Real Cost of a Breakdown — Line by Line

A breakdown is never just the repair cost. Every unplanned stoppage triggers a chain of costs that most fleet managers only partially capture. Here is the full cost stack for a mid-size infrastructure project fleet when a critical machine goes down unexpectedly.

Cost Element
Paper / Reactive Fleet
PM-First Fleet (HVI)
Saving per Event
Emergency spare parts (overnight / air freight)
₹45,000–₹1,80,000
₹8,000–₹35,000 (scheduled order)
Up to ₹1.45L
Labour overtime (emergency repair crew)
₹12,000–₹40,000
₹3,000–₹8,000 (planned servicing)
Up to ₹32,000
Machine downtime (standby crew, delayed pour)
8–36 hrs avg downtime
0–4 hrs (PM window)
32+ productive hours
Penalty / delay damages (contractual)
₹50,000–₹5,00,000+
Near zero (avoided)
Up to ₹5L per event
Crane / substitute equipment hire
₹25,000–₹90,000/day
Not required
Full daily hire avoided
Secondary component damage (consequential)
Frequent — hydraulics, gearbox cascade
Rare — caught before cascade
₹80,000–₹4,00,000 avoided

ROI by Machine Type — What PM Actually Returns

Preventive maintenance ROI is not the same for every machine class. Heavy-cycle machines with high utilisation rates and expensive components see the biggest returns. Here is how the numbers break down across the equipment types most common on Indian infrastructure sites.

Tipper / Dumper (15–20T)
Avg annual breakdown cost ₹18–28L
Annual PM programme cost ₹3.5–6L
Net saving per machine/year ₹12–22L

82% cost reduction potential
Excavator (20–35T)
Avg annual breakdown cost ₹28–42L
Annual PM programme cost ₹5–9L
Net saving per machine/year ₹19–33L

76% cost reduction potential
Transit Mixer (6–9 cu.m)
Avg annual breakdown cost ₹12–20L
Annual PM programme cost ₹2.5–4.5L
Net saving per machine/year ₹8–16L

74% cost reduction potential
Crane (Mobile / Tower)
Avg annual breakdown cost ₹35–60L
Annual PM programme cost ₹7–12L
Net saving per machine/year ₹23–48L

80% cost reduction potential
Start Tracking PM on Every Machine

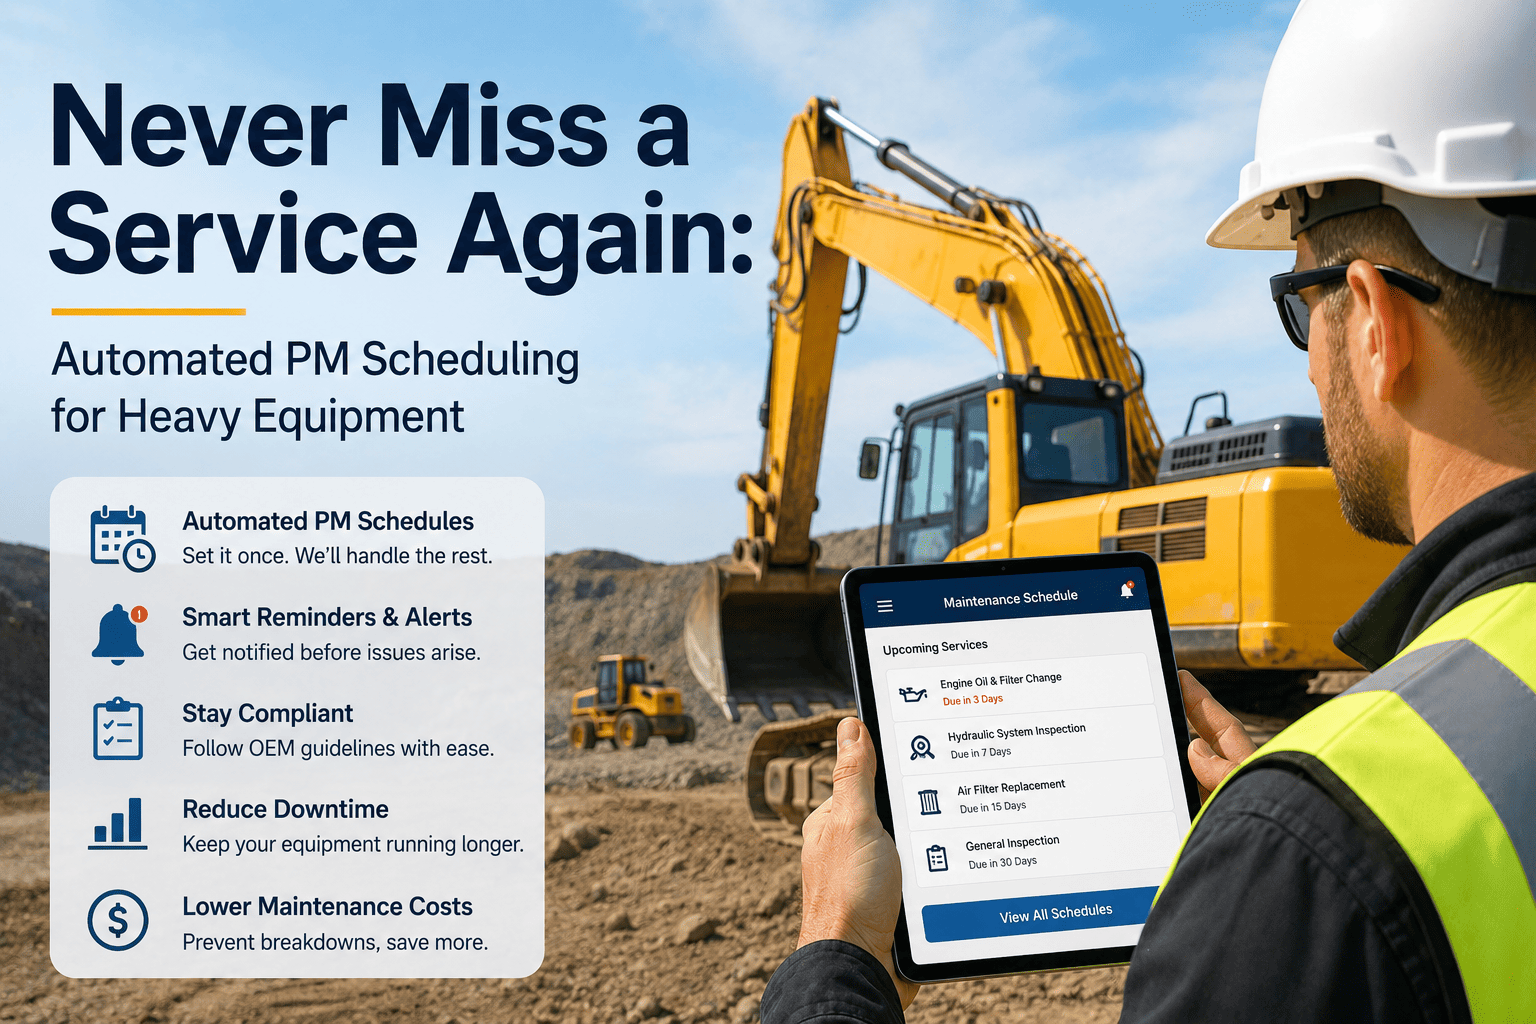
HVI gives you scheduled PM checklists, inspection alerts, defect tracking, and a live dashboard showing which machines are due, overdue, or at risk — across your entire fleet, from one screen.

How to Calculate Your Fleet's PM ROI — The 4-Step Method

You don't need a finance team to calculate whether preventive maintenance is worth it. This four-step method works for any fleet size and gives you a usable number within 20 minutes using data you already have.

Step 1

Calculate Your Current Annual Breakdown Cost

Add up all repair invoices from the past 12 months across your fleet. Include parts, labour, and contractor bills. If you don't have clean records, use the industry estimate: multiply your total fleet value by 12–18% — that is the typical reactive maintenance spend for Indian infrastructure fleets without a PM programme.

Annual breakdown cost = Total repair invoices (12 months) + Emergency hire + Delay penalties
Step 2

Estimate What PM Would Cost to Run

A structured PM programme for a medium fleet (20–50 machines) typically costs 4–7% of fleet value annually — covering scheduled servicing, consumables, and inspection labour. This includes the cost of a digital inspection tool like HVI. Add labour for PM technicians if not already in your payroll.

PM programme cost = Fleet value × 4–7% + Inspection tool subscription
Step 3

Apply the Preventability Rate

Not every breakdown is preventable — but 60–70% of them are on average for road and infrastructure equipment. Multiply your current breakdown cost by 0.65 to get a conservative estimate of what a PM programme would eliminate. This becomes your addressable saving.

Addressable saving = Annual breakdown cost × 0.65
Step 4

Calculate Net ROI

Subtract the PM programme cost from your addressable saving. Divide by the PM cost and multiply by 100 to get a percentage ROI. Most infrastructure fleets running this calculation find a net ROI between 280% and 520% in year one alone — without accounting for extended machine life or insurance savings.

Net ROI (%) = ((Addressable saving – PM cost) ÷ PM cost) × 100

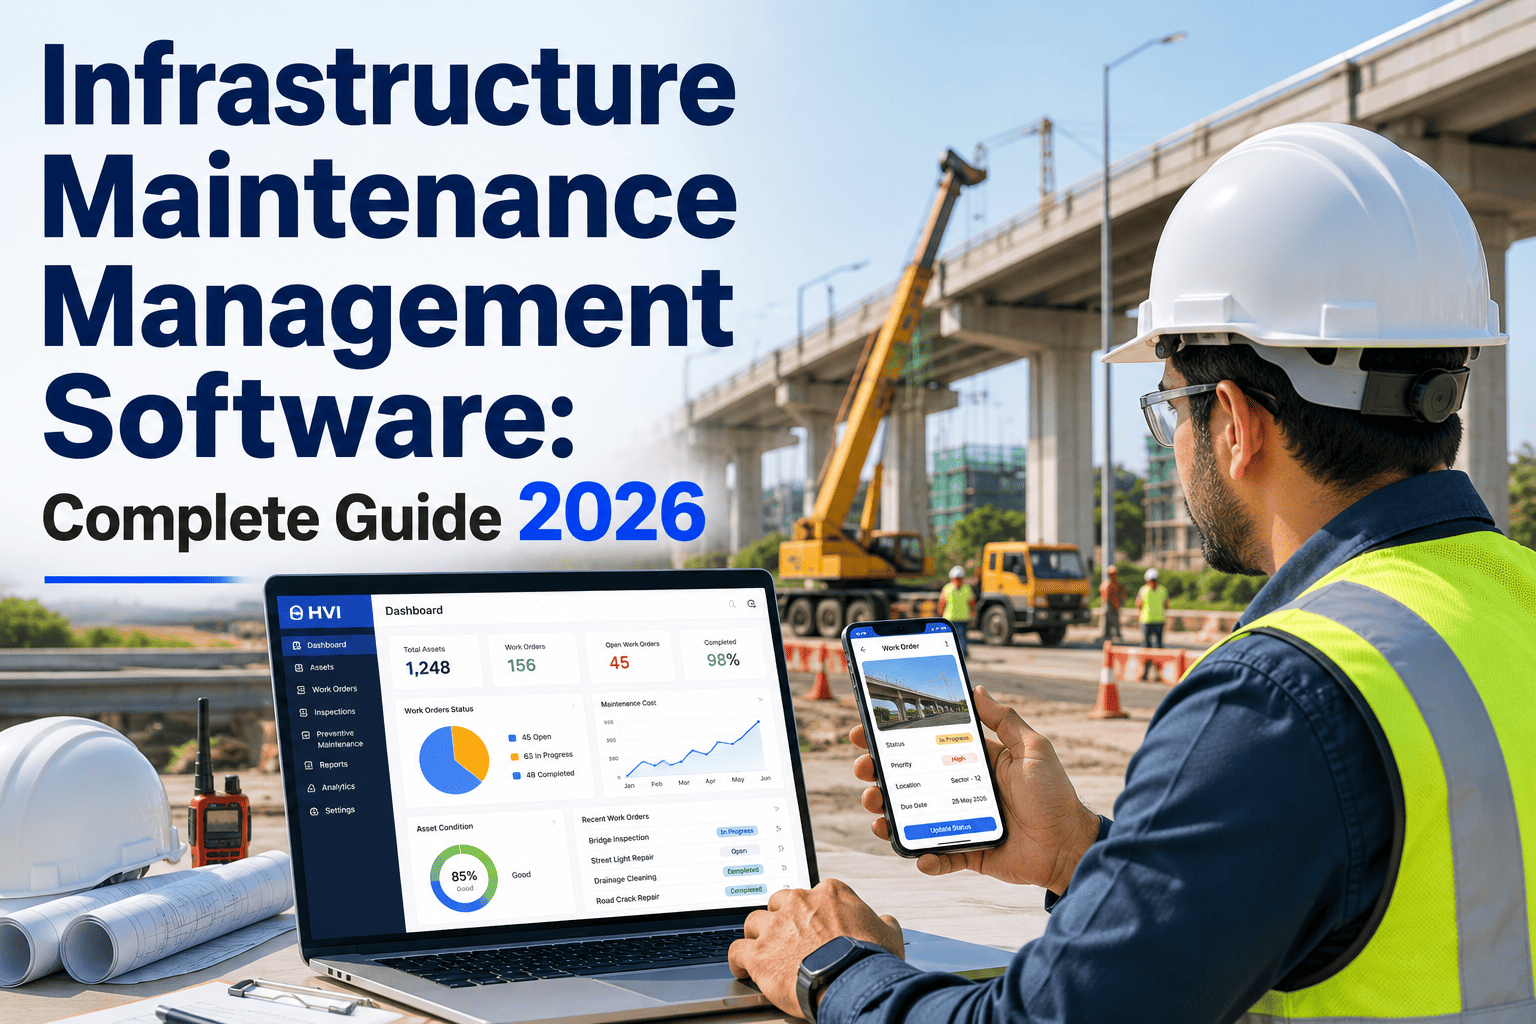
What Changes When You Run PM Through HVI

The difference between a PM programme on paper and one tracked digitally through HVI is not just convenience — it is the difference between planned cost and untracked cost. Here is what actually changes operationally when your PM runs through HVI's inspection and scheduling tools.

PM schedule sits in a supervisor's notebook or Excel file
Instead
Every machine's next PM date is visible on the HVI dashboard with countdown and alert
Technician marks "done" — no record of what was actually checked
Instead
Digital PM checklist captures each item, photo proof, timestamp, and technician ID
Defects spotted during PM are noted verbally or on paper — often lost
Instead
Defects auto-generate work orders routed to the right mechanic with photo attached
Audit-time: 3–4 days compiling service records from folders and WhatsApp
Instead
Full PM history for any machine pulled in seconds — searchable, timestamped
No visibility into which machines are PM-overdue across multiple sites
Instead
Live fleet health dashboard — PM compliance rate, overdue count, risk flags
PM compliance depends entirely on supervisor memory and follow-up
Instead
Automated reminders sent to operators and supervisors before PM is due

We had 68 machines across three NH packages and our maintenance records were in five different Excel files maintained by different site managers. When we ran the numbers, we were spending roughly ₹4.2 crore a year on breakdowns and about ₹60 lakh on planned servicing — meaning 87% of our maintenance spend was reactive. After moving PM tracking to HVI and running structured 250-hour and 500-hour service cycles digitally, our reactive spend dropped to under ₹1.1 crore in 14 months. The ROI was clear by month four.

Maintenance Head, EPC Contractor — 68 Machines, NH Projects, Rajasthan

Frequently Asked Questions

How accurate is the 3–5x reactive vs PM cost ratio for Indian infrastructure fleets?
The ratio is derived from maintenance spend data across EPC, highway, and mining fleets in India. The range reflects fleet age, machine type, and utilisation intensity. High-utilisation fleets (2 shifts+) and older machine populations (8+ years) tend toward the 5x end. Newer, lower-utilisation fleets typically sit at 3–3.5x. Use HVI's cost tracking to measure your own ratio against actuals.
Does HVI help you schedule PM intervals or only track inspections?
HVI handles both. You can set PM schedules based on calendar intervals (weekly, monthly), machine hours, or odometer readings. When a machine approaches its PM threshold, HVI flags it on the dashboard and sends reminders to the assigned operator and supervisor. Book a demo to see the scheduling tools in action.
What fleet size does preventive maintenance ROI apply to — only large fleets?
ROI from PM is actually stronger for smaller fleets (10–30 machines) because a single major breakdown represents a higher share of total fleet output. A 20-machine fleet losing one excavator for 5 days loses 5% of its daily capacity immediately. PM ROI is significant at any fleet size above 5–6 machines.
Can we track spare parts consumption through HVI to see where PM costs are going?
Yes. HVI allows you to log parts used during each PM or repair, linked to the specific asset and work order. Over time, this builds a parts consumption history per machine, helping you identify which assets have abnormally high consumable spend — a leading indicator of approaching major failure.
How long before a fleet starts seeing measurable ROI after starting PM on HVI?
Most fleets see the first measurable impact within 60–90 days — typically a reduction in emergency repair callouts and faster defect-to-work-order turnaround. Full ROI on reduced breakdowns typically materialises at the 6–12 month mark as the PM schedule catches wear issues before they become failures. Start tracking free on HVI today.

Zero Credit Card · Live in Days · Full Fleet Coverage

Stop Paying 3–5× More Than You Need To on Maintenance

HVI gives your fleet a structured PM programme with digital checklists, scheduled service alerts, defect-to-work-order routing, and a live compliance dashboard — replacing paper schedules, notebook reminders, and reactive panic with a system that runs ahead of failures instead of behind them.

PM compliance tracked per machine
Defects caught before breakdown
Full service history per asset
Audit-ready records in seconds
280–520% Typical first-year PM ROI for infrastructure fleets switching to HVI
Start Free PM Tracking on HVI Book a 30-Min ROI Walkthrough
Trusted by EPC, highway, mining and infrastructure fleets across India

Share This Story, Choose Your Platform!