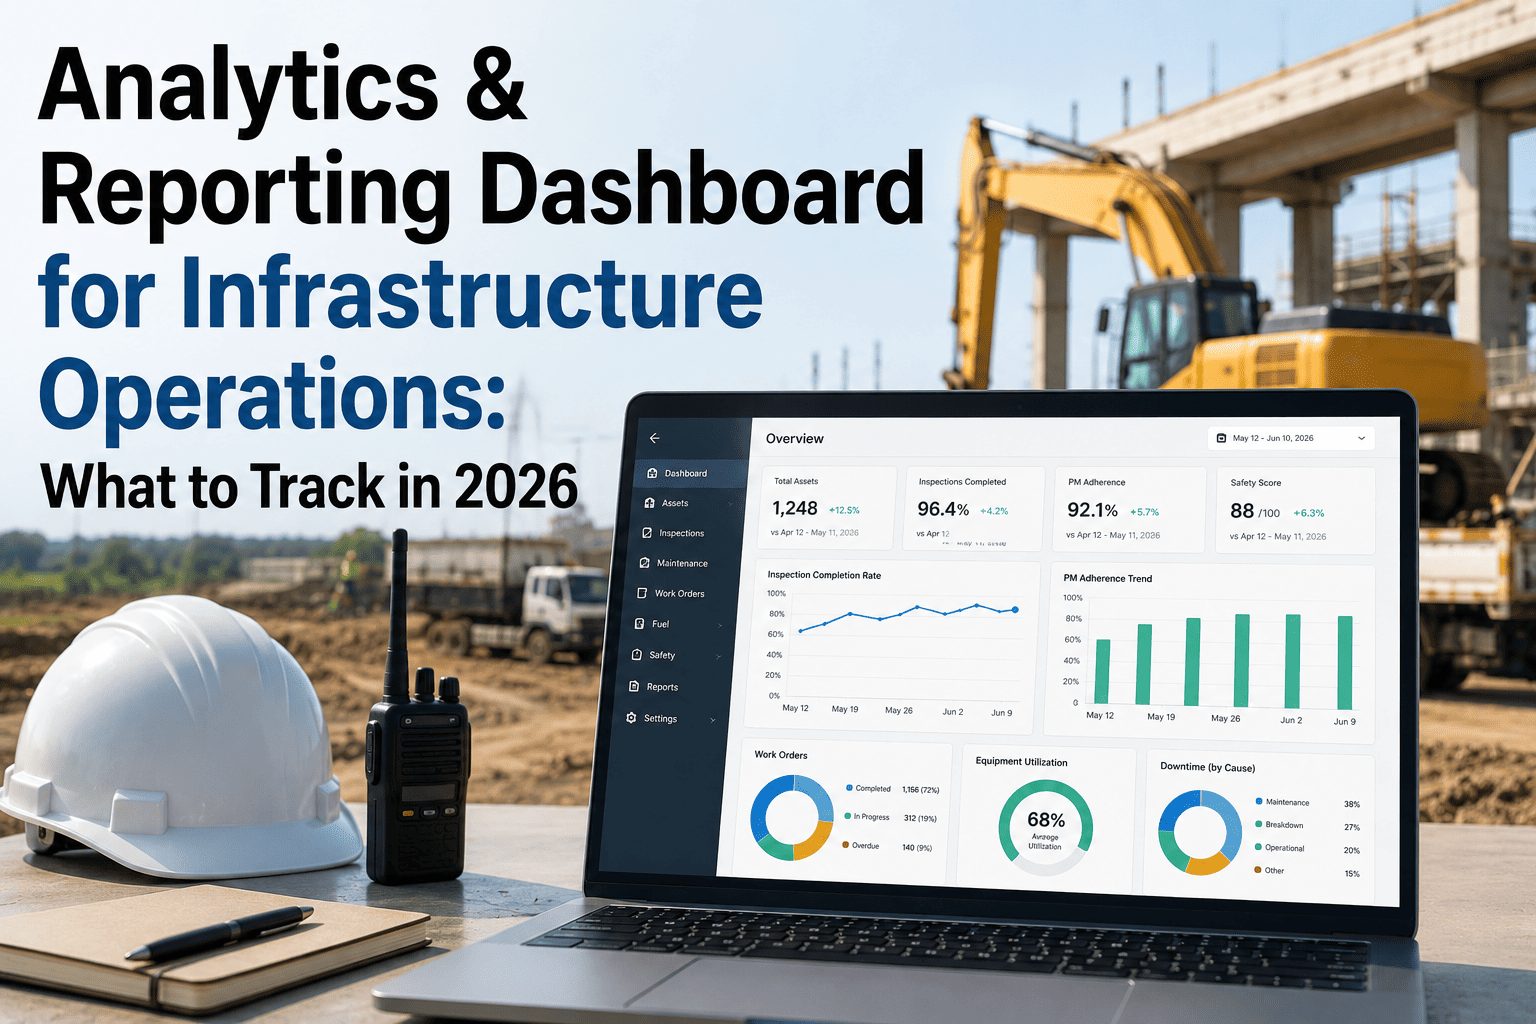
Running 50 machines across one site is a logistics job. Running 500 machines across 12 sites in four states is an information problem. The moment a fleet spreads across multiple packages, the real challenge is not equipment — it is visibility, escalation, and consolidated reporting across sites that each feel like separate operations.
Multi-Site Equipment Operations in India: Dashboards, Reporting & Best Practices
A practical guide to managing heavy equipment across multiple Indian EPC, highway, and mining sites — fleet-wide dashboards, mobile reporting, exception escalation, and the HVI enterprise approach that scales from 3 sites to 30.
India EPC market CAGR — fleet sizes growing faster than management systems can track
India EPC market research, 2024Large-scale government projects delayed in 2024 — equipment visibility across sites is the first casualty
Mordor Intelligence, India 2024Typical reporting lag between site activity and head-office visibility on paper-based multi-site fleets
HVI fleet deployment dataPM compliance improvement after centralised fleet platform deployed across 20 sites
HVI multi-site deployment case studyThe 5 Problems That Appear the Moment You Have More Than One Site
Each of these problems is manageable at one site. Across four or five sites simultaneously, they compound into a reporting and control crisis that no spreadsheet can solve.
No Consolidated Fleet View
Each site has its own WhatsApp group, its own daily report format, and its own understanding of what a "utilization rate" means. The fleet manager at head office pieces together five different Excel sheets on Friday evening and still does not know the real picture.
Critical Defects Do Not Escalate
A P1 hydraulic failure on Site 3 is reported verbally to the site supervisor, who calls the workshop head, who sends a mechanic on Monday. Meanwhile the machine sits down for three days. No one at head office knows until the monthly review.
PM Slippage Is Invisible Until Breakdown
At one site, the workshop in-charge is diligent. At another, PMs are deferred when the machine is on a critical deadline. Head office has no visibility until the breakdown report arrives — by which time the PM overdue is academic.
Equipment Stranded at Low-Utilization Sites
A dozer sitting at 35% utilization on Site 4 could be redeployed to Site 2 where a similar machine is at 92% and creating a bottleneck. Without cross-site utilization data in one view, this redeployment decision never happens.
Client Audits Take 3 Days to Prepare
NHAI, Coal India, or a metro authority asks for a fleet compliance and utilization report across all packages within 48 hours. Three site managers, six register books, and a weekend of Excel work later, the report is submitted with errors.
Every one of these is a visibility problem, not a maintenance problem. The machines are fine. The information flow is broken. Book a 30-minute demo to see how HVI solves all five on one platform.
The Multi-Site Reporting Hierarchy
Effective multi-site fleet management runs on three distinct levels of information — each level consuming reports from the one below and producing decisions that flow back down. Get this hierarchy wrong and reports pile up without producing action.
Strategic View
- Fleet utilization % by project and region
- Total maintenance cost vs budget
- Equipment redeployment decisions
- Scrappage / procurement pipeline
Operational View
- Machine-level utilization and downtime trends
- Open defects and PM overdue count
- Maintenance cost per operating hour by machine
- Escalation to head office for P1 events
Execution View
- Today's inspection completion rate
- Open work orders and parts status
- PM due in next 7 days
- Defect cards raised vs resolved
HVI auto-generates all three views from the same operator-side data entry. The site supervisor sees today's work orders. The project manager sees the weekly trend. The fleet director sees the cross-site utilization comparison — all without any manual report compilation. Start free with HVI to run all three levels from day one.
Exception Escalation — How P1 Events Should Flow Across Sites
On a well-run multi-site fleet, a critical defect raised by an operator at 06:00 on Site 3 should have a mechanic assigned and a work order open before 10:00 — and the project manager at head office should know about it before 07:00. This is the escalation chain that makes that happen.
-
06:00
Defect Raised by Operator
Operator raises P1 defect on HVI mobile app with 3 photos. System auto-classifies as critical based on defect type. GPS-stamped to Site 3, machine ID EX-07.
-
06:01
Instant Alert to Site Workshop In-Charge
Automatic P1 push notification fires to the site workshop in-charge. Machine is flagged as out-of-service on the site dashboard. No verbal report required.
-
06:05
Alert to Project Manager and Fleet Head
Because the defect is P1, a second alert automatically fires to both the project manager and the head-office fleet director. They see the machine, the defect, and the photo before their morning tea.
-
06:30
Work Order Created, Mechanic Assigned
Workshop in-charge creates work order from the defect card in one tap. Mechanic assigned with target resolution time. Parts availability checked against site inventory.
-
Target: 10:00
Resolution or Escalation Decision
If mechanic closes the work order, machine returns to service. If parts are unavailable, fleet director sees the open P1 and can authorise emergency procurement or cross-site equipment transfer — all from the same dashboard.
What a Good Multi-Site Dashboard Shows
Not every number belongs on a multi-site dashboard. The goal is exception management — surface the sites and machines that need attention, not a wall of data that requires 20 minutes to read. Here are the six metrics every Indian fleet director's dashboard must show.
Site Utilization Heatmap
Each site shown as a colour-coded tile — green above 70%, amber 50–70%, red below 50%. Instant identification of underperforming sites without reading a table.
Open P1 & P2 Defects by Site
Count of unresolved critical and high-priority defects per site. Any site with a P1 open for more than 8 hours is a red flag that demands immediate attention.
PM Compliance Rate by Site
Percentage of machines with all scheduled PMs up to date per site. A site dropping below 80% compliance is a leading indicator for increased breakdowns in the next 30 days.
Cross-Site Utilization Comparison
Bar chart of utilization % per site, updated daily. Machines at 35% on one site while the same type runs at 90% on another is the redeployment signal a fleet director needs.
Daily Inspection Completion Rate
Percentage of machines that completed pre-shift inspection today, per site. A site below 70% completion is either not using the app or rushing through checks — both need correction.
Maintenance Cost Per Operating Hour
The single financial metric that unifies all sites. Rising cost-per-hour on one site relative to others identifies a machine approaching end-of-life or a workshop with poor PM discipline.
HVI's enterprise dashboard shows all six of these metrics in one screen, updated in real time from operator-side mobile entries. Get HVI free and see your multi-site fleet on one screen from today. Not sure which metrics matter most for your fleet size? Book a 30-minute demo and we will walk through your exact setup.
Expert View from the Field
Managing 380 machines across 8 NHAI packages spread from Rajasthan to Andhra Pradesh means I am essentially running 8 separate workshops and 8 separate operations, each with its own team and its own reporting habit. Before HVI, my Friday evening was consumed by chasing 8 site WhatsApp groups for utilization summaries that arrived in different formats and different levels of accuracy.
After HVI, I open one dashboard at 8 AM and know exactly which site is underperforming, which machine has an open P1, and which packages have PM overdue. The April 2026 NHAI audit for three of our packages was completed from a single HVI compliance report — no site manager had to prepare anything separately. That audit used to take a full week of preparation across three sites. It took 45 minutes with HVI.
Manohar Desai, Head of Plant and Machinery, GR Infraprojects, Pan-India — 380 machines across 8 active NHAI packages
HVI Best Practices for Multi-Site Equipment Operations
These are the configuration and operational practices that Indian EPC and mining fleet managers have found most effective when deploying HVI across multiple sites.
Standardise Machine-Class Inspection Templates Across All Sites
Use the same inspection template for every PC210 on every site, every JCB 3DX on every site, every tipper on every site. This allows cross-site defect trend analysis — if boom hose failures are appearing on PC210s across three sites simultaneously, that is an OEM advisory conversation, not a site-level issue.
Set Site-Level PM Compliance Thresholds with Auto-Escalation
Configure HVI to auto-alert the project manager when any site's PM compliance drops below 80%. This removes the workshop in-charge's ability to quietly defer PMs during peak construction windows — the manager is notified before the deferred service becomes a breakdown.
Run Weekly Cross-Site Utilization Reviews, Not Monthly
Monthly reviews catch redeployment opportunities 3 weeks too late. A weekly cross-site utilization check — under 30 minutes using the HVI enterprise dashboard — surfaces the dozer at 35% on Site 4 before the bottleneck on Site 2 has cost another week of delays.
Log Every Cross-Site Equipment Transfer in HVI
When a machine moves from Site 1 to Site 3, its PM schedule, service history, open defects, and compliance documents should move with it — not stay behind with Site 1. HVI's transfer record ensures the receiving site sees the full machine history from day one, preventing the "we didn't know the PM was overdue" situation.
Generate Client Reports by Project, Not by Site
NHAI packages often span multiple physical sites with one AC number. Configure HVI project groupings to match your contract structure — not your physical site layout — so that the utilization and compliance report you submit to NHAI matches the billing structure exactly.
WhatsApp / Excel Multi-Site Reporting vs HVI Enterprise Dashboard
- ×8 sites send 8 different report formats every Friday
- ×P1 defect stays on one site for 3 days before head office hears
- ×PM overdue only visible when the machine breaks down
- ×Cross-site utilization comparison takes a full day
- ×Client audit report takes one week of manual work
- ×Machine transferred between sites loses its history
- ✓One live dashboard — all sites, same format, real time
- ✓P1 escalates to head office automatically in 5 minutes
- ✓PM compliance visible per machine, per site, always
- ✓Cross-site utilization heatmap updated daily
- ✓Client audit report generated in under 1 hour
- ✓Machine history travels with the machine on transfer
For Indian EPC, highway, and mining companies running more than 3 active sites simultaneously, the WhatsApp-and-Excel model breaks down completely above 100 machines. Sign up free with HVI and put every site on one enterprise dashboard this week.
Frequently Asked Questions
How does HVI handle equipment operating across multiple NHAI packages?
HVI supports a project hierarchy where each physical site can be mapped to a parent NHAI or client project. A machine can be assigned to a specific site within a project, and when it transfers between sites on the same package, the assignment is updated but the full history stays linked to the machine, not the location. Reports can be generated at site level, project level, or fleet-wide — so a single machine's utilization and compliance data can appear in the correct NHAI package report regardless of which physical site it is currently operating from.
Can different site teams have different access levels in HVI?
Yes. HVI supports role-based access across the enterprise. Operators can raise inspections and defects for their assigned machines only. Workshop in-charges see all machines and work orders at their site. Project managers see all sites within their project. The fleet director or head of plant sees the entire enterprise. Subcontractor users can be given restricted access to raise and view their own equipment records without seeing the client's proprietary fleet data. This role structure is especially useful on Indian EPC sites where 4 to 8 sub-contractors often run parallel operations under one main contractor.
What is the best reporting cadence for a multi-site Indian fleet?
Based on HVI deployment data, the most effective cadence for Indian multi-site fleets is: daily automated exception alerts to site supervisors and project managers for any P1 defect, PM overdue by more than 50 hours, or inspection completion below 70%; weekly cross-site utilization review by the fleet director (30 minutes using HVI enterprise dashboard); and monthly consolidated fleet performance report for head-office management and client billing. The daily layer catches issues before they escalate. The weekly layer drives redeployment decisions. The monthly layer feeds financial and procurement decisions.
How do you manage equipment transfers between sites in HVI?
When a machine is transferred from one site to another, HVI's equipment transfer feature logs the transfer date, the sending site, the receiving site, the hour meter reading at transfer, and the condition at the time of transfer (inspection record). All previous service history, open defects, compliance documents, and PM schedule travel with the machine to its new site assignment. The receiving workshop in-charge is automatically notified with the machine's full profile including any outstanding work. This eliminates the common Indian site problem of machines arriving at a new site with no maintenance history visible to the new workshop team.
How does HVI help prepare client-facing fleet compliance reports for NHAI audits?
HVI's multi-site report module generates a consolidated fleet compliance report for any project or package that includes: machine-level utilization by shift and week, FC, PUC, and insurance compliance status, PM completion history with dates and hour readings, open defect register with resolution status, and daily inspection completion rate per machine. The report is exportable as a dated PDF with the organisation's logo and package reference. For NHAI, NHIDCL, and Coal India audits, this document typically covers all the fleet compliance evidence requirements in a single submission.
Run Every Site on One Enterprise Fleet Dashboard
HVI's enterprise platform gives Indian fleet directors a single live view across all active sites. Real-time utilization, auto-escalating P1 alerts, cross-site PM compliance, equipment transfer history, and one-click client audit reports. Built for EPC, highway, and mining fleets from 3 packages to 30.
No credit card. No hardware. Live on your fleet in under 10 minutes.