Two drivers can run the same truck on the same route and produce very different bills. One brakes hard, accelerates sharply and idles for an hour at every stop. The other drives smoothly and steadily. The first uses more diesel, wears brakes and tyres faster and takes more risks. Driver behaviour scoring turns telematics data into a clear, fair scorecard, so good drivers can be rewarded and risky habits coached before they cause harm. This guide explains how it works, and how fleets link driver scores to maintenance costs in HVI.
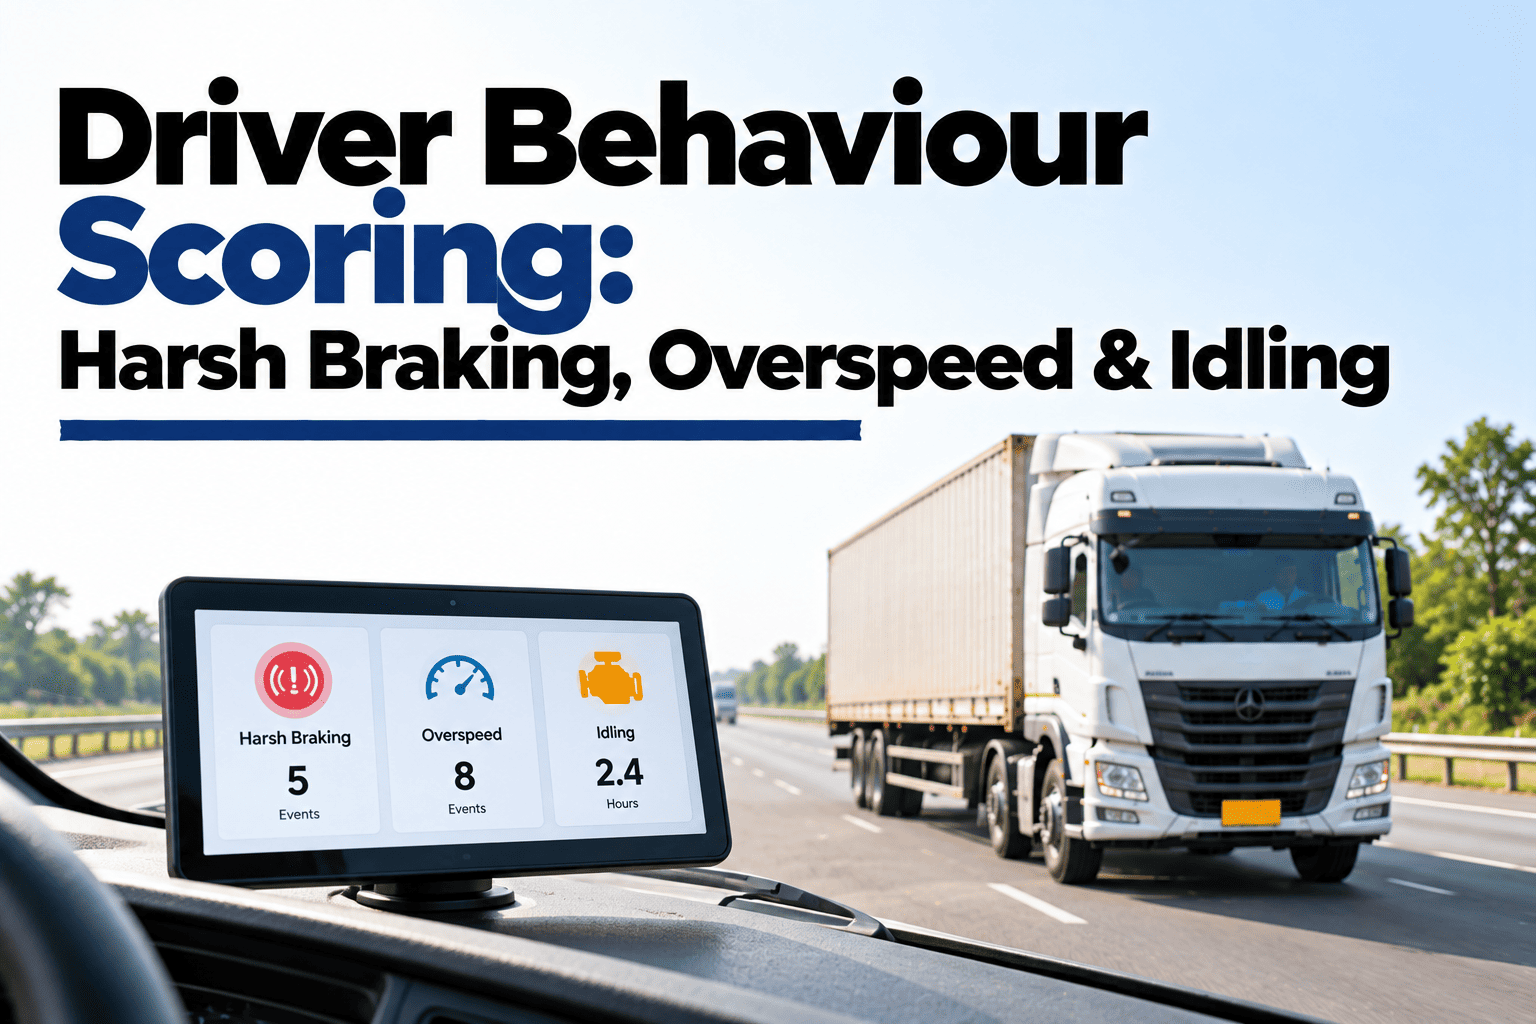
Driver Behaviour Scoring: Harsh Braking, Overspeed and Idling
How scoring works, how to make it fair for Indian roads, what to do with the results and how scores connect to fuel, brake and tyre costs.
What Each Behaviour Costs
Telematics devices detect these events from speed, acceleration and engine data. Each one has a real cost.
| Behaviour | How it is detected | What it costs |
|---|---|---|
| Overspeeding | Speed above the set limit for the road or vehicle | Higher accident risk, more fuel and fines |
| Harsh braking | Sudden drop in speed beyond a set threshold | Brake and tyre wear, cargo damage, rear-end risk |
| Harsh acceleration | Sudden rise in speed beyond a set threshold | More fuel, clutch and driveline wear |
| Excess idling | Engine running while the vehicle is stationary | Wasted fuel and extra engine hours |
| Night and long driving | Driving at night or for long hours without rest | Fatigue and higher accident risk |
How a Fair Score Is Calculated
A good score compares drivers on equal terms, no matter how far each one drives.
Count events
Record each event type for every driver.
Per 100 km
Divide by distance so long-haul drivers are not penalised.
Apply weights
Give riskier behaviours more weight in the total.
Score out of 100
Combine into one score and track the monthly trend.
In the example scorecard, overspeed carries 30 points and idling 15, because speed has the bigger effect on safety. Set weights to match your own priorities.
Keeping the Scheme Fair
Drivers accept scoring when they trust it. These rules make that trust easier to earn.
Compare like with like
Group drivers by route type, such as city, highway or ghat roads.
Filter false events
Allow for potholes, speed breakers and genuine emergencies.
Be open
Show drivers their own scores and let them question events.
Focus on trends
Judge improvement over months, not one bad day.
Connect Driving Habits to Real Costs
HVI keeps fuel, brake, tyre and repair records for each vehicle and driver, so you can compare them with driving scores, see what risky driving really costs and coach where it matters.
What to Do With the Scores
Scores are only useful when they lead to action. A simple banding keeps it clear for everyone.
Recognise and reward
Public recognition, incentives and first choice of routes.
Coach
Short one-to-one talk on the one or two habits to improve.
Focused training
Targeted training, a ride-along and a review after a month.
The band limits here are an example. Set your own once you have a few months of data for your fleet.
Incentive Ideas That Work
Positive rewards usually change behaviour faster than penalties.
- Monthly bonus for top-scoring drivers
- Share of fuel savings for efficient drivers
- Driver of the month recognition at the depot
- Preference for newer vehicles or better routes
- Punishing drivers for events they cannot control
- Ranking drivers on very different routes together
- Using scores without explaining them
- Changing the rules without notice
Driver Scores and Vehicle Costs in HVI
A sample monthly view for drivers on similar highway routes. Lower scores line up with higher running costs.
| Driver | Score | Fuel efficiency | Brake and tyre cost per km | Action |
|---|---|---|---|---|
| Driver A | 91 | 4.2 km per litre | Rs 1.9 | Reward |
| Driver B | 78 | 3.9 km per litre | Rs 2.4 | Coach on braking |
| Driver C | 64 | 3.5 km per litre | Rs 3.1 | Focused training |
Driver Behaviour Scoring FAQs
What is driver behaviour scoring?
It is a way of rating each driver using telematics data on overspeeding, harsh braking, harsh acceleration, idling and similar events. The events are combined into a single score so drivers can be compared fairly and coached.
How do you make a driver score fair?
Measure events per 100 km, compare drivers on similar routes, filter out false events such as potholes and emergencies, show drivers their own data and focus on trends over several months rather than single days.
Does better driving really lower maintenance costs?
Smooth driving usually means less brake, tyre, clutch and driveline wear, as well as lower fuel use. Comparing scores with each vehicle's repair and tyre records shows the effect in your own fleet.
Should poor scores lead to penalties?
Coaching and training usually work better than penalties, especially at first. Rewards for good drivers encourage others to improve. Teams that track scores in HVI can see whether coaching is working.
What do I need to start scoring drivers?
You need telematics data from each vehicle, a clear scoring method, agreed rules shared with drivers and a regular review. Linking scores to cost records makes the results more useful. Book a demo to see this in HVI.
Reward Good Driving, Coach the Rest
Turn driving data into fair scorecards and link them to fuel, brake and tyre costs in HVI. Safer drivers, lower running costs and a team that knows what good looks like.